Need to Run a Chi Square Goodness of Fit Test in Excel?
It's easy - just follow this Excel CHITEST function step by step example
NOTE: There are many types of Chi square tests.
If you need to run one of these other types of tests, consider using QI Macros add-in for Excel:
Chi Square Goodness of Fit Test
A Chi Square Goodness of Fit test evaluates the probabilities of multiple outcomes.
Chi Square Goodness of Fit Test Example - Las Vegas Dice
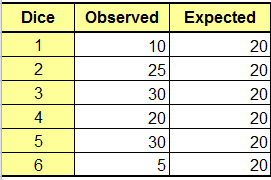
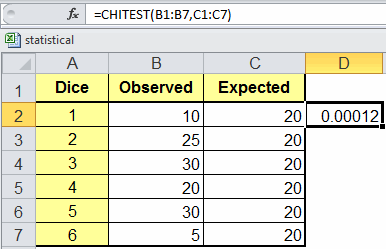
Let's say you want to know a six-sided die is fair or unfair (Advanced Statistics by Dr. Larry Stephens). If the die is fair then each side will have an equal probability of coming up; if not, then one or more of the sides will come up more often. Now, test 120 rolls of the die and enter the data into Excel. We would expect each side of the die to come up 20 times (120/6):
Then, in an empty cell, begin typing the formula "=chitest(" and Excel will prompt for the observed and expected ranges:
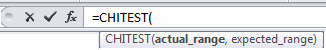
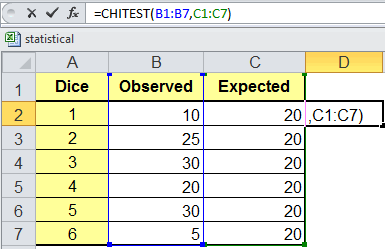
Use your mouse to select the Observed (actual_range) and Expected range. Put a comma between the two and a parenthesis at the end and hit return.
The Chi Square test will calculate the probability (i.e., p value) of all sides being equal:
Interpreting the Chi Square Goodness of Fit results
- H0: p1 = p2 = p3 = p4 = p5 = p6 = 1/6
- Ha : At least one p is not equal to 1/6
If |
Then |
| p value < a | Reject the null hypothesis |
| p value > a | Cannot Reject the null hypothesis (Accept the null hypothesis) |
In the above results the p value = .00012 which is much lower than our alpha value of 0.05, so, we can reject the null hypothesis that the die is fair.
Haven't you waited long enough?
Start running Chi square tests in just minutes.
Download a free 30-day trial. Run Chi square tests on your data now!
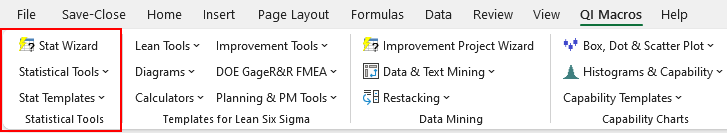
Chi square tests are one of many statistical tests included in QI Macros add-in for Excel.
QI Macros adds a new tab to Excel's menu, making it easy to find any tool you need. You will find the statistical tools and templates on the far left side of QI Macros menu.