Struggling to Run a Z-Test in Excel?
QI Macros can run a z test and interpret the results for you in seconds!
When to use the Z-Test two sample for means
- To compare population and sample means to determine if there is a significant difference.
- To compare means between two samples.
- To compare the mean of one sample to a given constant.
The Z-test is typically used in evaluating the results of standardized tests. Are the results from a sample of students outside of or within the standard test performance?
z Test Example using QI Macros add-in for Excel
New Training Technique Designed to Increase IQ - This example was taken from Statistical Analysis in Excel for Dummies by Joseph Schmuller.
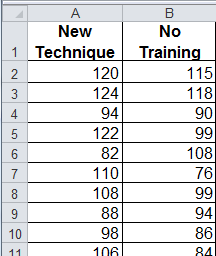
Imagine a new training technique designed to increase IQ. Take a sample of 25 people and train them using the new technique. Take another sample of 25 people and give them no special training. Input the results in Excel.
To conduct a z test using QI Macros add-in:
- Click and drag over your data to select it.
- Now click on QI Macros Menu > Statistical Tools > f and t tests > Z-Test two sample for means test.
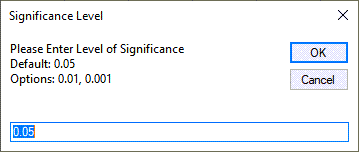
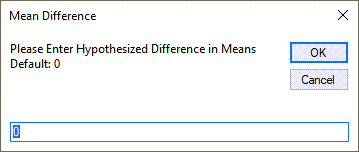
- QI Macros will prompt you to enter a significance level (default = 0.05) and a hypothesized mean difference (in this case 0).
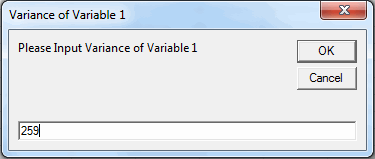
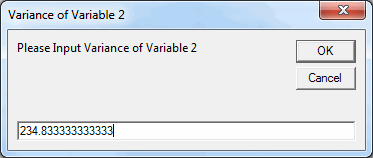
- QI Macros will calculate the variance for each data set selected and give you the opportunity to type in another value if appropriate.
- Q Macros will perform the z test calculations AND interpret the results for you:
- QI Macros will also draw a Values Plot to help you visualize the data.
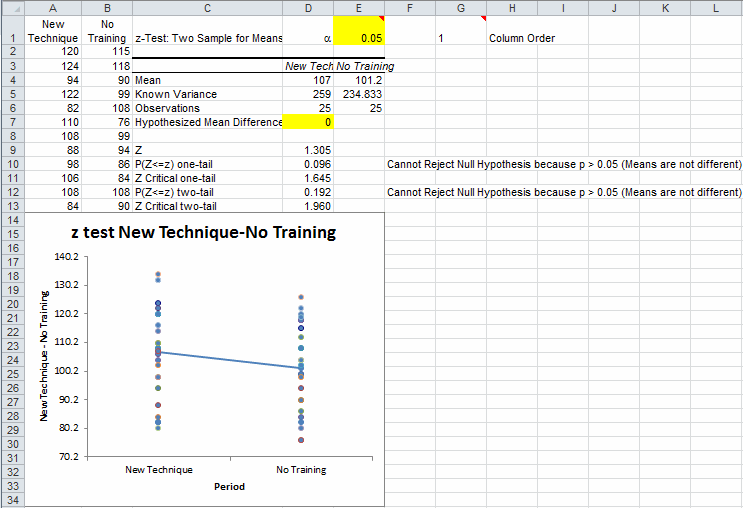
Interpreting the z test Results
QI Macros compares the p-value (0.192) to the significance level (0.05) and interprets the result for you. In this example we "Cannot Reject the Null Hypothesis because p > 0.05 (Means are not Different)."
- The null hypothesis H0 is that the mean difference = 0
or in other words the means are the same
- The alternative hypothesis Ha is that the mean difference is > 0
or in other words that the mean of the trained population is larger
If |
Then |
| test statistic > critical value (i.e. z> zcrit) |
Reject the null hypothesis |
| test statistic < critical value (i.e. z< zcrit) |
Cannot Reject the null hypothesis (Accept the null hypothesis) |
| p value < a | Reject the null hypothesis |
| p value > a | Cannot Reject the null hypothesis (Accept the null hypothesis) |
Since the null hypothesis is that the means are the same this is a two-sided test. Therefore, use the two-tail values for your analysis.
Since the z statistic < zcritical (1.305 < 1.960) and p value > a ( 0.192> 0.05) , we cannot reject the null hypothesis (accept the null hypothesis) that the means are the same.
One-Sample Z-Test
To do a one-sample z-test on the New data above, use native Excel formulas in an empty cell:
- =ztest(A1:A26,100)
- Gives p=0.015
- Since the p-value is < 0.05, we can Reject the Null Hypothesis (Means are Different/Means are not the Same).
