Want to Show ∓ 2 Control Limit Lines as Warning Limits?
QI Macros makes it easy to choose which control limits to display!
Why it Matters:
Most users prefer to display only the upper and lower control limits on their control charts. Therefore, QI Macros defaults to this option. However, QI Macros makes it possible to view the ∓ 1 and 2 sigma lines using the Chart Menu.
Users who want to view the ∓ 1 and 2 sigma lines, use them to better understand why points are highlighted as unstable and as "warning limits" to more closely evaluate their data.
Control Limit Display Options in QI Macros
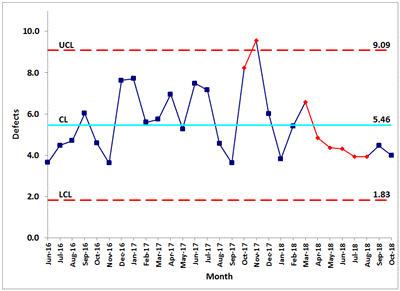
Control Chart Showing Only the ∓ 3 Sigma Lines
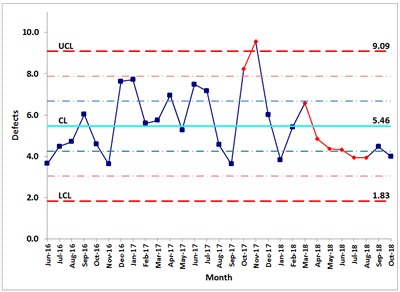
Control Chart Showing ∓ 1 and ∓ 2 Sigma Lines
Don't Confuse the Limits Displayed With Stability Analysis Rules
Whether the sigma lines are displayed or not, they are still used to identify and highlight out of control conditions. QI Macros defaults to Montgomery's Rules but you can customize the stability analysis rules using the Control Chart Rules menu.
To Display the 1 and 2 sigma lines on a QI Macros Control Chart:
- Click on the control chart.
- Click on the QI Macros chart menu
- Select Show/Hide Sigma Lines and choose the option you want:

Learn more about other QI Macros control chart update options
Stop Struggling with Control Charts!
Start creating your Control Charts in just minutes.
Download a free 30-day trial. Get Control Charts now!
QI Macros Draws These Charts Too!
