Not sure if you can create control charts and histograms using time and date data?
You can if you are using QI Macros SPC Software
Recently, I was at the ASQ Six Sigma conference and one attendee was bemoaning the fact that he couldn't create a control chart using "time format" data in his existing SPC software. He was surprised when I showed him how easy it can be done in QI Macros for Excel
Control Charting Time
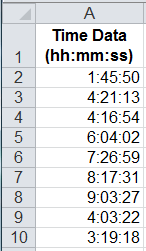
When collecting performance metrics, he was using time in Excel format (hh:mm:ss). QI Macros can easily turn this data into a control chart or histogram. Start by selecting the data, just like any other data, and then choosing the chart you want from the QI Macros menu.
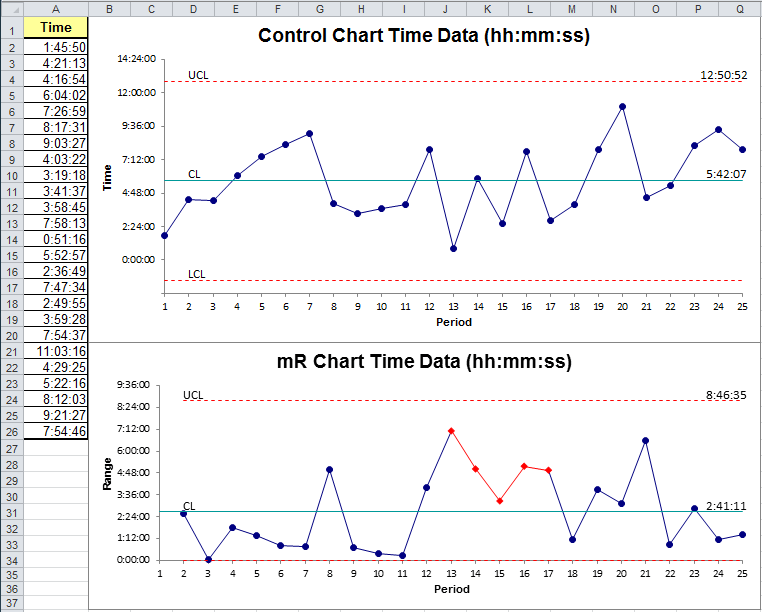
For example, using the above data an XMR chart would look like this:
Histograms of Time
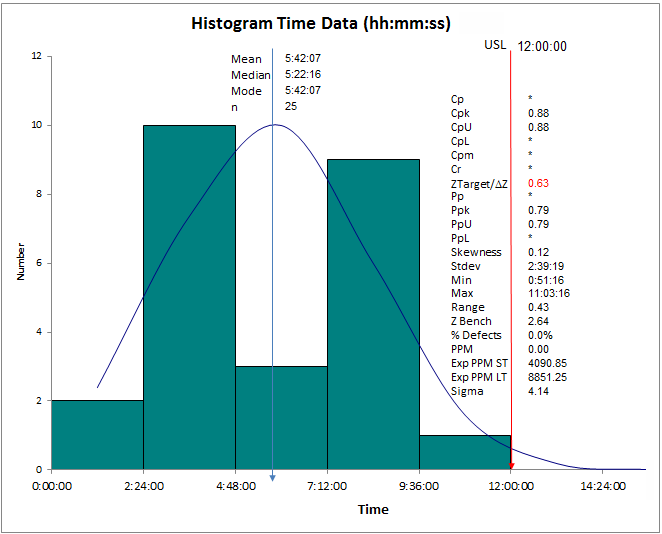
Use the same approach to create a histogram. Select the data and choose "Histogram with Cp and Cpk". When working with time data, there is usually an upper specification limit (USL) to do a task, but not a lower specification limit. To create a histogram with only an USL, click "Cancel" on the LSL prompt.
Control charts and histograms of time are easy using QI Macros. Try it and see.
Learn More
- Watch video of creating a control chart in Excel using QI Macros
- Control Chart Types
- Control Chart Stability Rules
Stop Struggling with Control Charts and Histograms!
Start creating your Control Charts and Histograms in just minutes.
Download a free 30-day trial. Get Control Charts and Histograms now!
QI Macros Draws These Charts Too!
