Fill-in-the-Blank Templates
QI Macros Lesson 3
In addition to the charts listed on the pull down menu, QI Macros contains more than 100 fill-in-the-blank templates.
To access these templates select Lean Six Sigma Templates on QI Macros pull down menu.
Excel 2013-2019 and Office 365

Each template is designed for Lean Six Sigma ease of use. Tools like the flow chart and fishbone diagram make use of Excel's drawing toolbar. To view Excel's Drawing Toolbar select View/Toolbars and click to the left of the word "Drawing."
Fill-in-the-Blank Templates for Charts
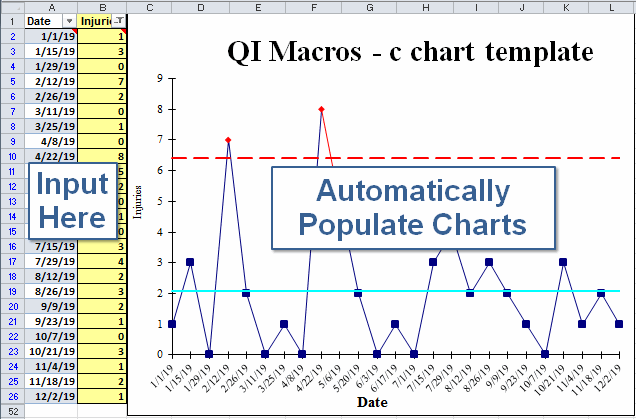
QI Macros contain templates for control charts, histograms, Cp and Cpk, probability plots, box and whisker, cusum, scatter and pareto charts. Just cut and paste or input data directly into the yellow shaded area. The charts will populate as data is input.
Control Chart Templates - contain different templates for control charts with rolling data, median charts, and short run charts. When you open a control chart template, look for these options within the various worksheets of each template.

Control Chart menu features on templates - include add data to chart, add text to point, ghost point and analyze stability. To access these features, click on a control chart and select "QI Macros Chart":

Delete point and show process change work differently on templates than on charts created with macros. Click on each item for more information.
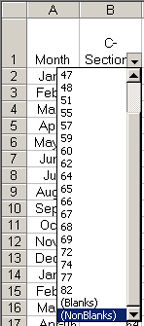
Choosing which points to plot - Each template defaults to 50 data points. If you have fewer than 50 points and only want to show the points with data, click on the arrow in cell B1. This will bring up a pull down menu. Select "non-blanks" to plot only the points with data.


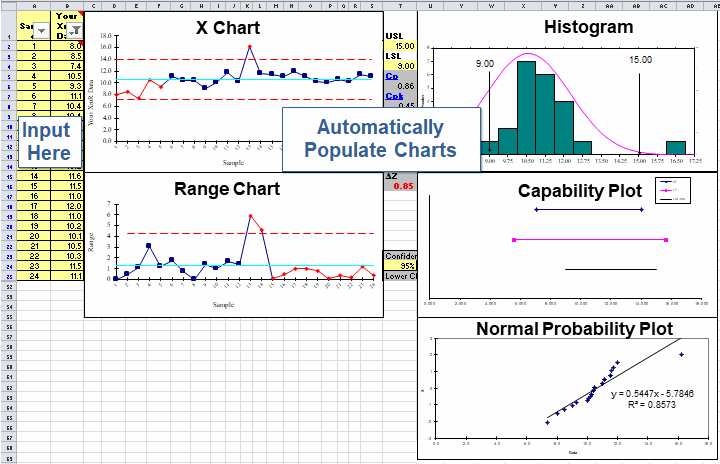
X chart templates contain a histogram and probability plot of your data.

Input the spec limits in the yellow shaded area between the control charts and histogram.

Design For Six Sigma Templates
AIAG PPAP, Gage R&R and More
QI Macros also contain many of the tools used by the AIAG. These tools are updated each time a new AIAG edition is published. Each template contains several different worksheets. Tools include:
- PPAP Forms - AIAG 4th Ed
- Control Plans
- Gage R&R - for more information on Gage R&R see our Gage R&R Whitepaper or Watch a Gage RR Video
Templates for Your Quality improvement Efforts
- Focus your improvement efforts using the Balanced Scorecard, Voice of the Customer Matrix or Cost of Quality template.
- Analyze and Improve using the Fishbone diagram or Ishikawa diagram, Countermeasures Matrix.
- Reduce delay using the Flowchart, Value Added Flow Analysis, Value Stream Map and Takt Time templates.
- Project management and planning - Gantt Chart, ROI Calculator and Project Management tools like the Earned Value Management Formulas.
In Lesson #4 we will cover Anova and Other Statistical Tools.
« Previous Lesson | Next Lesson »

