Box and Whisker Plot Comparisons
Compare QI Macros to other SPC Software
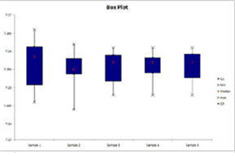
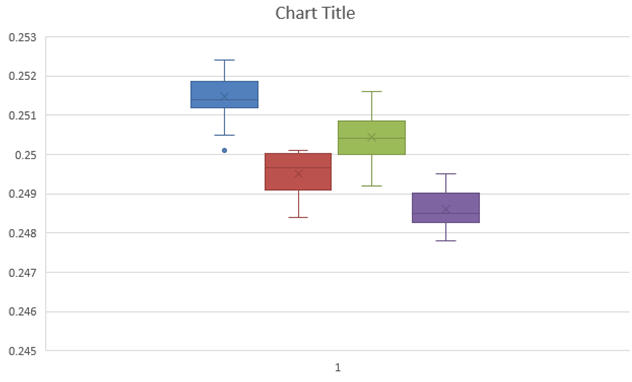
Compare Box and Whisker Plots on price, highlighting quartiles with different colors and identification of outliers.
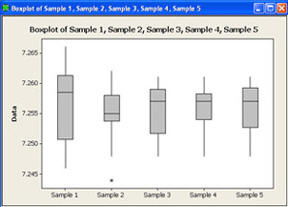
Minitab® Annual License: $1,851
Second and third quartiles within the box are the same color. Only shows the furthest outlier.
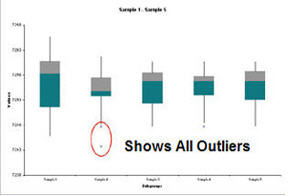
QI Macros® - $369 USD
Different colors highlight second and third quartiles. Shows all outliers.
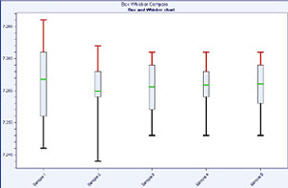
SQC Pack® - $1,290
Second and Third Quartiles within the box are the same color. Only shows max and min values not outliers as defined by most SPC texts.
QI Macros®
Different colors highlight second and third quartiles. Shows all outliers.
SigmaXL® - $299
Second and Third Quartiles within the box are the same color. Only shows the furthest outlier.
QI Macros®
Different colors highlight second and third quartiles. Shows all outliers.
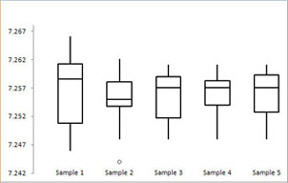
SPC XL® - $299
QI Macros® - $369 USD
Different colors highlight second and third quartiles. Shows all outliers.
Excel
QI Macros®
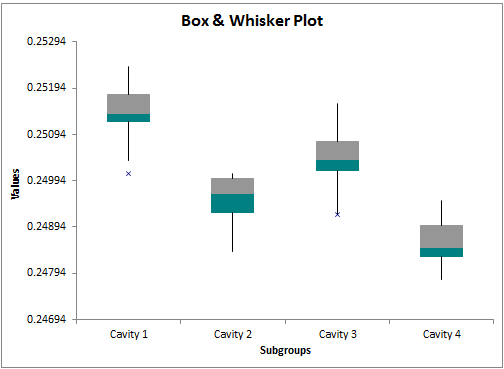
Different colors highlight second and third quartiles. Shows all outliers. Viewable in all versions of Excel.
Still not convinced? See this SPC software ease of use comparison.
No matter what the criteria, QI Macros' Box and Whisker Plot can't be beat.
What People are Saying...
I have been a fan and advocate for QI Macros for about as long as you have been in business. For the past 10 years I have been an ISO 9000 Consultant and use QI Macros for my data analysis and have had most of my customers buy QI Macros. All of my customers are small companies, QI Macros meets and exceeds their needs at a fraction of the costs of a Minitab or other similar products.
Tom Arneson, Focus Consulting LLC

