Looking for an Easy Way to Make Histograms in Excel?
QI Macros Histogram Maker Couldn't Be Easier to Use!
Draw a Histogram using QI Macros:
- Select your data.
- Select Histograms & Capability from QI Macros menu.
- QI Macros will do the math and draw the graph for you.
Excel's Histogram Generator Can be Confusing
Excel can create a Histogram from your data, but its interfaces are difficult to understand. First open the Data Analysis tools.
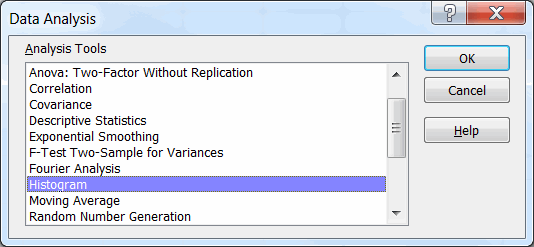
Then define your data range, bin range, output range, etc, etc to get a histogram:

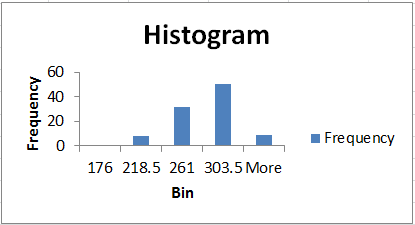
Compare QI Macros Histogram with the Histogram Made by Excel
Which would you rather give to your boss or customer?
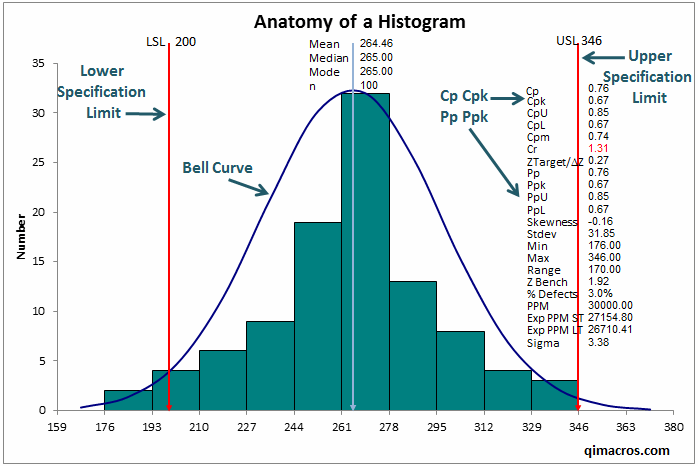
If you only want the histogram and not the metrics, just hit "cancel" on the specification limit prompts.
Stop Struggling with Histograms!
Start creating your Histograms in just minutes.
Download a free 30-day trial. Get Histograms now!
QI Macros Draws These Charts Too!
