Need to Change Bars or Bin Width on a Histogram in Excel?
QI Macros makes it easy to update # of bars, bin width and more.
After you create a histogram using QI Macros, you may want to increase the number of bars, change the bin width or the spec limits. QI Macros makes all of the changes easy to complete.
When You Create a Histogram Using QI Macros, You'll Get:
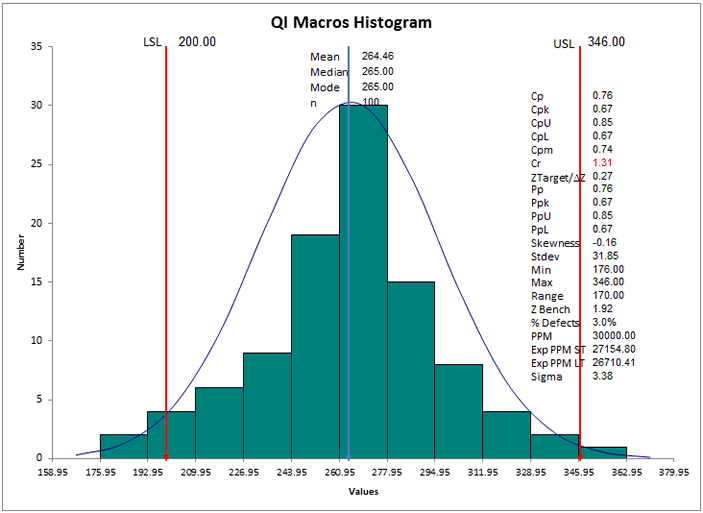
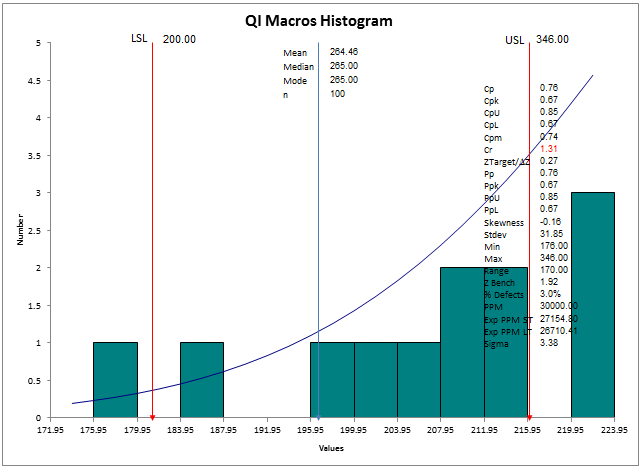
The Histogram
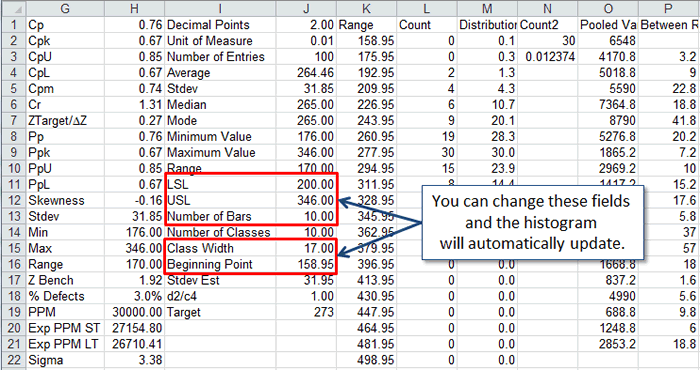
The Data Calculations Worksheet
How to Update a Histogram After it is Created
To move arrows or text boxes:- Arrows: Click on each arrow and drag it to the appropriate position. To extend an arrow, click on it, then click on the handle at either end and extend the arrow.
- Text: Click on each text box and drag it to sit on top or beside its corresponding arrow.
To revise the spec limits and process capability calculations:
Switch to the data calculations sheet. You can change the USL and/or LSL by typing over the current values in the cells provided. Excel will recalculate Cp, Cpk and Pp, Ppk and update the contents of the text boxes on the chart.
To change the number of bars, class width and beginning point of the x axis.
Simply type over the highlighted cells to change the calculations and histogram.
You can also change:
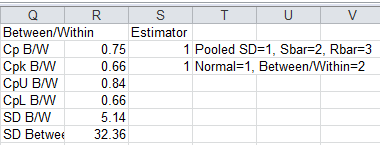
- The method used to calculate the estimator. Pooled Standard Deviation (1) is the default, but you can switch to Sbar (2) or Rbar (3) by scrolling to the right and changing the value in cell S2.
- The calculations used for Cp and Cpk in cell S3.
Notes about changing the # of bars and class width
Note that you can change the number of bars used on the chart by changing either the number of bars field OR the class width field in the Histdata sheet. if you want an exact number of bars, use the class width field. Change the class width in small increments until you get the number of bars desired.
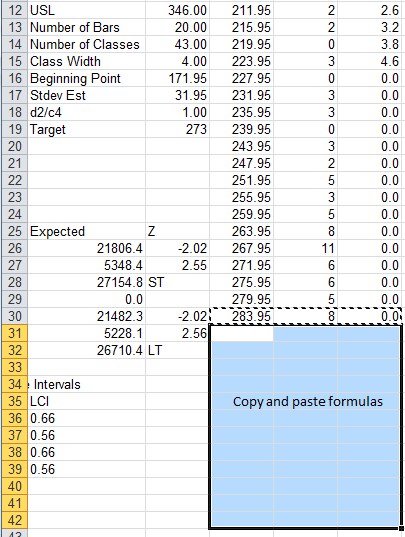
If you change the number of bars, you may need to copy and paste the formulas down to new cells:
Then go to the Histogram chart and see if it is still centered on the page. In this example, we changed the number of bars from 10 to 20. After the change the chart looks like this:
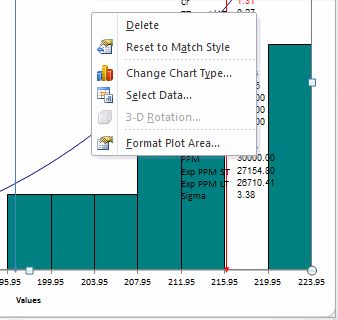
Next, we need to update the Source Data the chart is graphing. Right click on the chart and choose "Select Data."
Excel will open a window with the source data used for each item on the chart. To update the source data, click on the name of the series and then Edit.
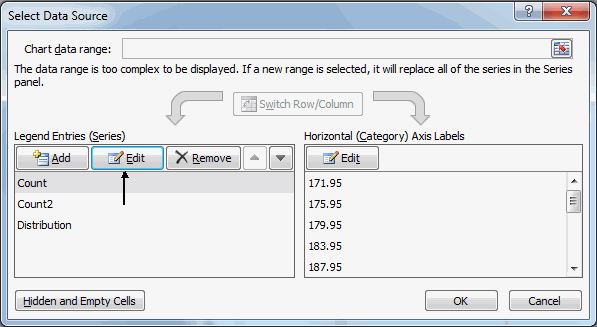
In the image above, we copied formulas down to row 44 before we started getting bars with zero values, so we need to change all references from row 26 to row 48 in the series window.
Change all of the values for the Count series, then click on Count 2 and Distribution and change the values for these series as well. Also, make sure to change the Horizontal (Category) Axis Labels range.
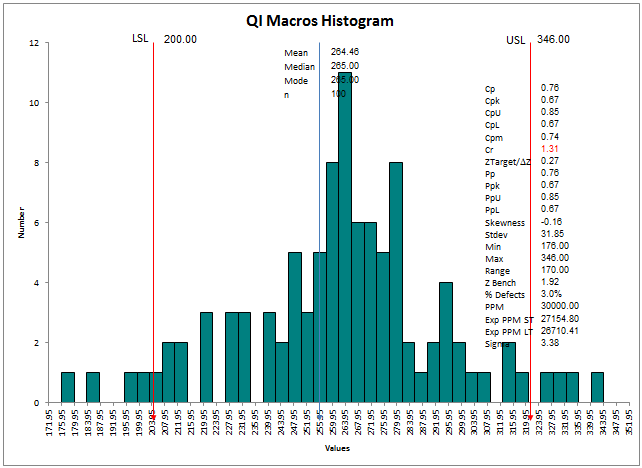
The updated chart should look like this:
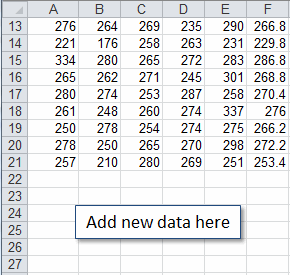
To add data, switch to the histdata sheet and add the new data:
Control Charts and Histograms
If you want to run control charts and histograms on the same data, consider QI Macros Capability Suite. It creates the same charts as Minitab's Capability Sixpack™
Stop Struggling with Histograms!
Start creating your Histograms in just minutes.
Download a free 30-day trial. Get Histograms now!
QI Macros Draws These Charts Too!
