Looking for a Box and Whisker Plot Example?
Learn how a box plot helped a client focus their efforts to reduce rework.
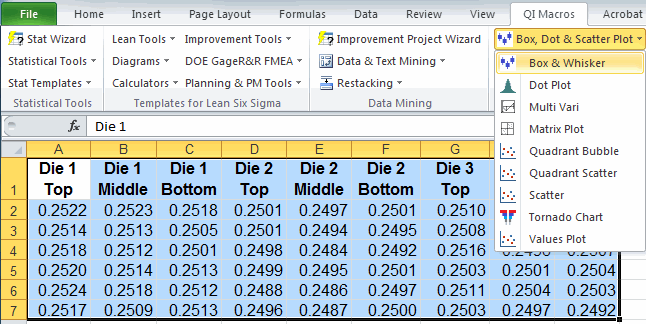
To draw a Box Plot using QI Macros:
- Select your data.
- Select Box, Dot & Scatter Plot > Box & Whisker from QI Macros menu.
- QI Macros will do the math and draw the graph for you.
Identify Where to Focus to Reduce Rework and Scrap
I was working with a client recently to solve problems with rework and scrap. One of the improvement teams manufactures a diecast cylinder about 3-inches long. The internal diameter varied from the top to the bottom. They took three sample measurements of internal diameter: top, middle and bottom. They asked me how I would illustrate the problem using QI Macros.
My immediate thought: Box and Whisker Plot.
So, I selected their data in Excel and created a Box & Whisker Plot using QI Macros
add-in:
Box and Whisker Plot created by QI Macros

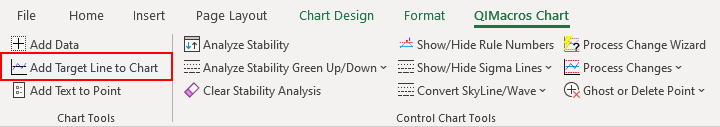
I added a target line of .25 to the Box and Whisker Plot using QI Macros Chart Tools menu:
Analysis of the Box and Whisker Plot
This chart served as the problem statement for the improvement team. From this it was clear that:
- Die 1 was running too large
- Die 2 too low
- Die 3 was closest to the target
The engineers immediately set to work figuring out how to resolve the issues and move the product onto target. They had to go back to the plant to test their countermeasures, but I could tell from their discussions that the problem would soon be solved.
How could a Box and Whisker Plot illustrate your quality problem?
Stop Struggling with Box Whisker Plots!
Start creating your Box Whisker Plots in just minutes.
Download a free 30-day trial. Get Box Whisker Plots now!
QI Macros Draws These Charts Too!
