Home »
Blog » Jay Arthur Blog » Page 7
Improvement Insights Blog
Latest "Jay Arthur Blog" Posts
While most COVID-19 charts show cumulative cases and deaths, I wondered what would happen if we turned the cumulative data into a daily data and plotted it as a control chart. It is possible to use c or XmR charts for this purpose. Process changes chosen based on runs and trends in the data.
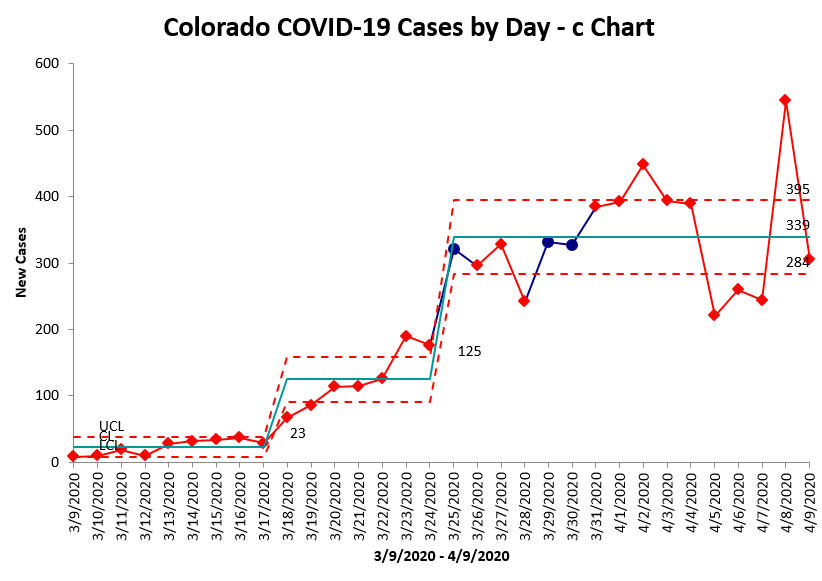
Daily new cases still unstable, but hovering around 339/day. Cases began to rise 3/18. Potentially leveling off 3/26. the date of state “stay-at-home” order.
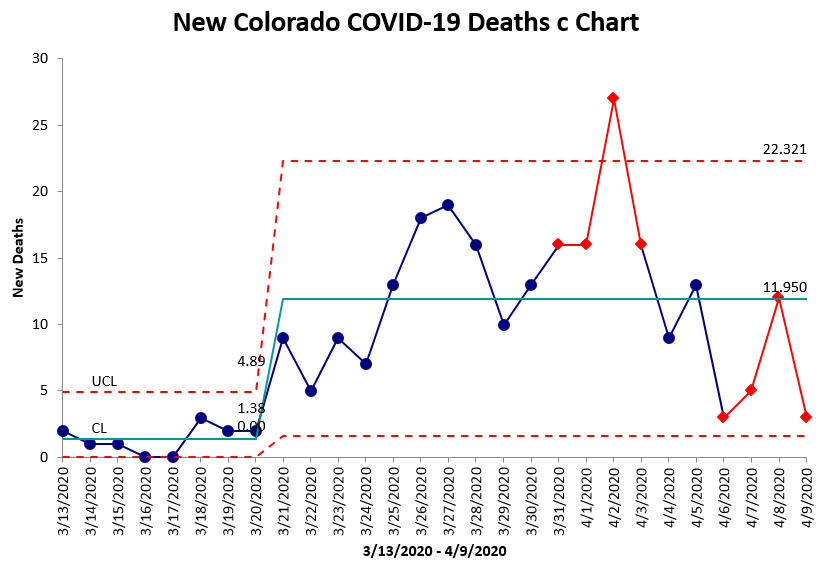
Daily deaths still unstable, but hovering around 12/day. Deaths began rising 3/21, but appear to be stabilizing. Significant spike on 4/2, root cause unknown.
Continue Reading "Colorado COVID-19 Cases and Deaths in Control Charts"
Posted by Jay Arthur in Jay Arthur Blog, QI Macros.
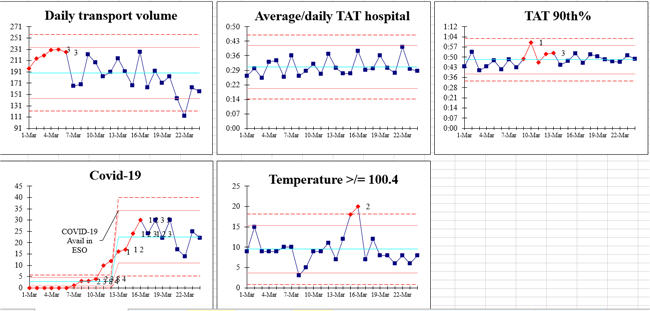
One of our QI Macros users offered to share his dashboard of paramedic response during the Seattle area response to COVID-19. His team transported the first COVID patient in America. As you can see, turnaround times (TAT) at the hospital averaged 30 minutes and temperatures spiked in transported patients.
Continue Reading "COVID-19 Paramedic Dashboard 2020"
Posted by Jay Arthur in Healthcare, Jay Arthur Blog, Lean, QI Macros.
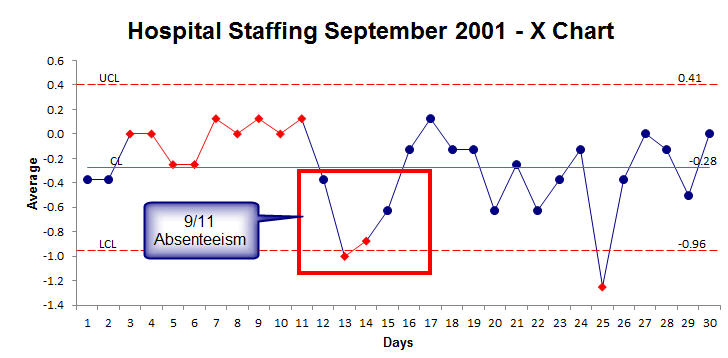
Back in 2002, thousands of miles from New York City, I worked with a hospital in Oregon. I was amazed to find that they had staffing data from 9/11 about the up and down for that month. As you can see in this X Chart, absenteeism (understaffing) was lower for each of the four following days, 9/12-15, and then recovered. I have noticed this pattern with COVID-19 as well: a week of paralysis followed by a return to normal. Unfortunately, healthcare workers haven’t had the luxury of downtime when dealing with the new crisis.
So don’t be surprised if crisis and uncertainty cause you or someone you know to hit the pause button.
Continue Reading "How Crisis Affects U.S. Healthcare Workers"
Posted by Jay Arthur in Healthcare, Jay Arthur Blog, Lean, QI Macros.
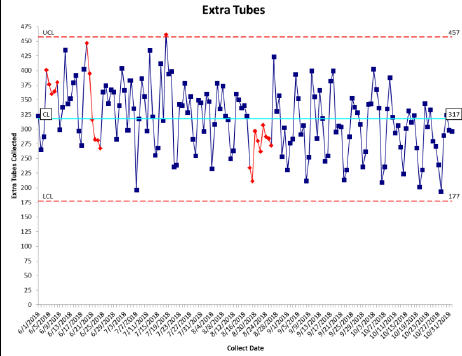
At the ASQ Lean Six Sigma Conference in Phoenix this week, Katie Castree with Accumen presented an excellent improvement story about reducing over-collection of blood tubes in a hospital. Here’s the story:
Baseline: 317 extra tubes of blood collected every day (115,705/year)
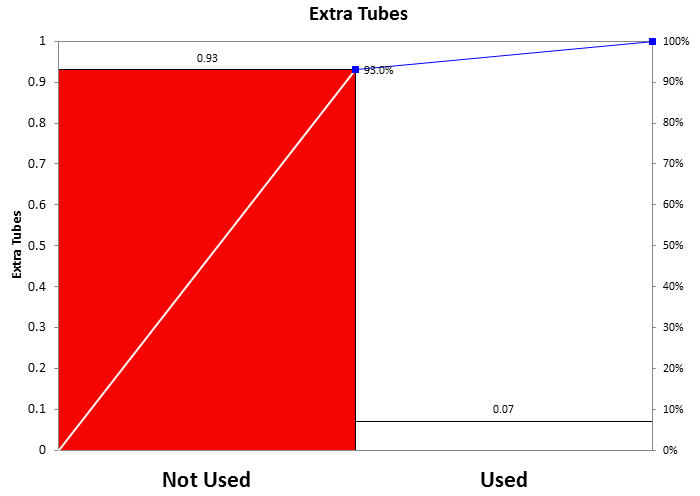
93% of tubes were not used (clinicians thought it was much higher and resisted changing)
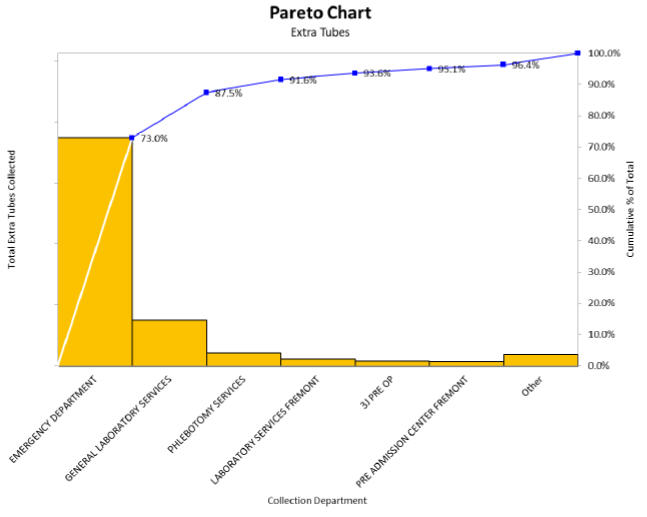
Most of the unused tubes were collected in the Emergency Department (focus on the ED, not the entire hospital).
After the countermeasure (not collecting tubes unnecessarily), extra tubes dropped from 317 per day to 118 per day saving $12,335/year and 0.27 FTEs. Over time, extra tubes dropped to only 84 per day, a 74% reduction.
Continue Reading "Reducing Blood Sample Over-Collection"
Posted by Jay Arthur in Agile Lean Six Sigma, Healthcare, Jay Arthur Blog, QI Macros, Six Sigma.
Answer: Almost always.
- When everything is presented in a bar chart, everything looks the same. And before long, everyone forgets what they’re looking at. Dan Roam
Bar charts always remind me of a Jack-O-Lantern with bad teeth.

Bar charts are one of the most misused charts. The most common mistake is using bar charts for time-series data (i.e., dates):
Bar charts are best used for categories—types of defects, objects, or whatever. Even so, the bars are often in a random order which makes distinguishing the important from the unimportant pretty difficult. Simply sorting the bars into a descending order makes them easier to analyze.
Continue Reading "When are bar charts dangerous?"
Posted by Jay Arthur in Jay Arthur Blog.
A lighthearted and (hopefully) humorous take on the world of statistics and those of us who make our way in it.
Hope you enjoy it!
Statistics Means Never Having to Say You’re Certain by Jay Arthur
Statistics means never having to say you’re certain
My hypotheses are Null
I’m just trying to cull
The signal from the noise
Because statistics means never having to say you’re certain
P values can’t be trusted
My analysis is busted
Because statistics means never having to say you’re certain
The alternative hypothesis
Is cramping my consciousness
Because statistics means never having to say you’re certain
My data isn’t normal
Tukey’s test seems so formal
Because statistics means never having to say you’re certain
You can prove the means are different
Equivalent but not the same
Because statistics means never having to say you’re certain
Wish they told me when I started
The results could all be charted
Because statistics means never having to say you’re certain
Continue Reading "Statistics Means Never Having To Say You’re Certain"
Posted by Jay Arthur in Jay Arthur Blog.
Many people use Run Charts as a way to introduce people to SPC. You can now create a Run Chart with QI Macros and easily change it into a Control Chart.
Watch a video demonstration of this new feature:
Click HERE if you would like more information on our current pricing.
And please note that if you have purchased a QI Macros license within the past (5) years, you are eligible to upgrade to the most recent version at a discounted rate!
Lastly, to view the latest features and enhancements we’ve added, click HERE.
Continue Reading "New QI Macros feature: Change Run Charts into Control Charts"
Posted by Jay Arthur in Jay Arthur Blog, QI Macros.
…that you are missing 32 pages? Here’s a photo of my copy of David Baldacci’s novel, Long Road to Mercy:

Missing 32 pages
Started reading the page only to find a character that couldn’t be at the bottom of the Grand Canyon at this point in the book. Just when it starts building up to a resolution, I’m sent backward in time.
This is not my idea of hassle-free.
Continue Reading "Have You Ever Read Most of a Book Only to Discover…"
Posted by Jay Arthur in Jay Arthur Blog.
Xcel left a message on our phone that we would “experience periodic electrical outages” because they are trying to conserve “natural gas usage due to cold weather.”
Can’t wait to reset all of our digital clocks.
Continue Reading "Xcel Energy Cuts The Power"
Posted by Jay Arthur in Jay Arthur Blog.
How to “hack” Lean Six Sigma for Healthcare Quality and Safety. Recorded at NAHQ 2018 in Minneapolis, MN.
Continue Reading "Agile Lean Six Sigma for Healthcare – NAHQ 2018"
Posted by Jay Arthur in Agile Lean Six Sigma, Healthcare, Jay Arthur Blog.

