
Statistics are Simple
People have been trying to make statistics simple and easy to understand for decades.
But statistics aren’t simple. Maybe we should change how we teach them?
People have been trying to make statistics simple and easy to understand for decades.
But statistics aren’t simple. Maybe we should change how we teach them?
Everyone seems to think that top down, leadership-driven is the only way to implement Lean Six Sigma. It’s not.
50 years of research proves that it fails half the time. Yep, 50% failure rate. That’s less than 1 sigma.
This type of failure is so common that it even has a name: The Stalinist Paradox.
The recent collapse of GE stock price has led to a lot of discussion. Here’s my two cents.
Jack Welch implemented Six Sigma at GE which drove many CEOs to do the same. From scuttlebutt I’ve picked up over the years, this lead to crazy rules like every employee had to do two Six Sigma projects a year. This would violate Pareto’s Rule: if only 20% of the business is creating 80% of the defects, waste and rework, having employees try to fix the remaining 80% of the business is a waste of resources. Six Sigma needs focus, not spread.
Jeffery Immelt reduced leadership support for Six Sigma.
This recent article talks about how GE measured Six Sigma success:
“Engineers and scientists were measured on how many Six Sigma projects they completed during the year.”
Since I know that 4% of the business is causing over half of the waste, rework and lost profit (the 4-50 rule), making everyone do “Six Sigma projects” is a form of overproduction (violating a Lean rule). It creates waste, rework and unhappy employees. It makes people put trivial improvements in Six Sigma format to achieve the goals.
Measure Six Sigma success by bottom-line, profit and productivity enhancing results, not projects. Use data to focus improvements to maximize results and minimize effort.
Lean Six Sigma Fundamentalists believe:
– Get management commitment
– Train lots of black and green belts
– Implement wall-to-wall floor to ceiling
Lean Six Sigma Revolutionaries believe:
-Engage informal leaders
-Train money belts
-Laser-focused, data-driven breakthrough improvements
Continue Reading "Lean Six Sigma Fundamentalists vs Revolutionaries"
The next time you hit a glitch are you going to
0. Ignore it
1. Find a work around
2. Take heroic action to fix it.
3. Fix the glitch and then take the time to prevent it from ever happening again?
The July/August 2017 HealthLeaders magazine had a series of charts about the impact of Adverse Events. In general, the magazine used column charts:
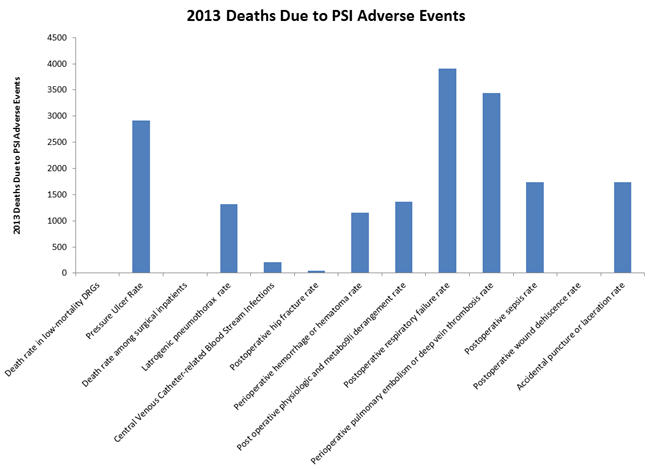
But wouldn’t a Pareto chart illuminate the important adverse events more clearly? The first three accounted for over 57% of 2013 deaths.
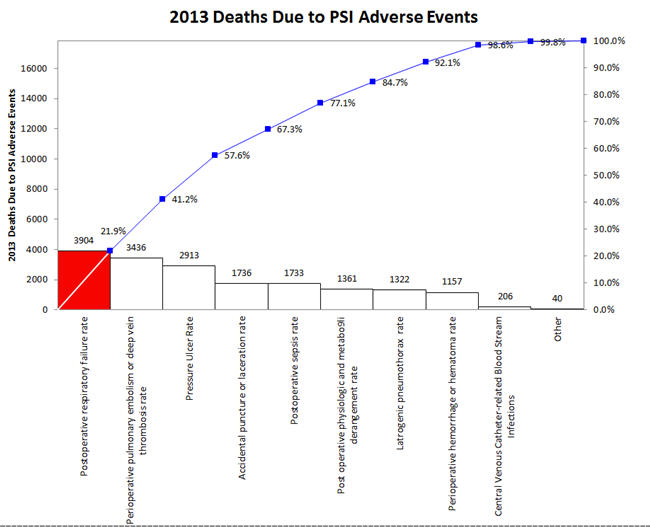
Continue Reading "Excel Bar Charts Hide The Signal in Noise"
I have found that an XmR chart is the easiest way to display attribute data. Simply convert the numerator/denominator into a ratio and plot the ratio.
Almost two decades ago, Tom Pyzdek said: X chart provides an excellent approximation to the p chart.
More recently, Donald Wheeler noted that XmR chart limits will be very close to c, np, p or u chart limits if the underlying distribution is correct.
Continue Reading "Use XmR Charts instead of c, np, p and u Charts"
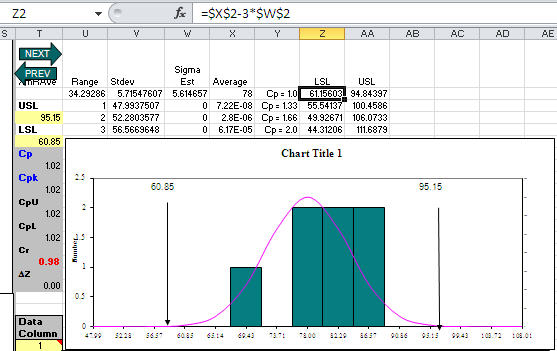
Customer asked me what seemed like a strange question: What specification limits do I need to get a Cp greater than one? Usually her customer should set specification limits, but her boss wanted to know what they could deliver. Hmmmm!
Then I realized that since QI Macros templates (e.g., XmR chart) calculate the average and sigma estimator, the LSL/USL for Cp = 1.0 would be:
LSL = Average – 3*SigEst USL = Average+ 3*SigEst
For Cp = 1.33, just change the 3 to a 4; Cp = 1.66, change the 3 to a 5. Here’s an XmR chart template with some sample data and calculations to reverse engineer spec limits:
A customer called upset about Cpk. He had a runout of 0.010, but was getting a very low Cpk. Turns out he’d made the classic mistake of confusing a hard limit (e.g., zero) with a specification limit. I had him use QI Macros with an Upper Specification limit (USL) and no Lower Specification Limit (LSL). His Cpk immediately jumped to a more expected value of 1.78.
Later in the day another customer asked why Cpk is calculated as the minimum of the upper or lower Cpk? Because you use the one closest to the average. I think that customer may have had the same problem, confusing a hard limit with a specification limit.

KnowWare International, Inc.
2696 S. Colorado Blvd., Ste. 555
Denver, CO 80222 USA
Toll-Free: 1-888-468-1537
Local: (303) 756-9144


