Home »
Blog » Manufacturing » Page 3
Improvement Insights Blog
Latest "Manufacturing" Posts
Over the last 25 years, I’ve gotten to see Six Sigma failures and successes. But in spite of all of the belts trained and investments made, why isn’t product and service quality any better? Why is there so much hassle? Why aren’t more customer experiences hassle-free? I’ve developed a mental list of the most common types of failures. Here’s my fishbone diagram for Six Sigma failures. I’d encourage you to develop your own.
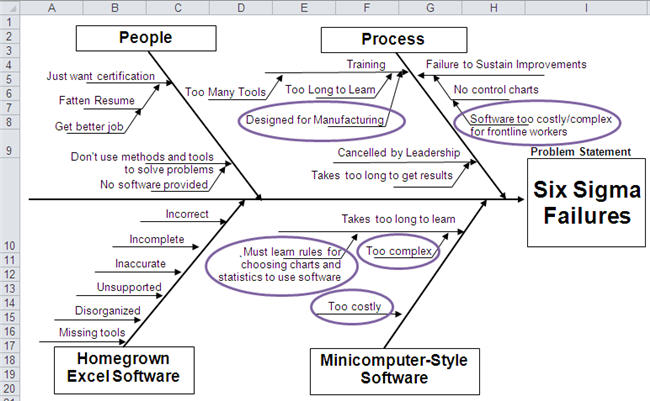
80% of the businesses in the U.S. are service businesses, yet Six Sigma training is extensively focused on the manufacturing factory floor. It takes too long to teach people everything they might need to know to solve all of the problems they might ever encounter.
Continue Reading "Why Six Sigma Fails"
Posted by Jay Arthur in Healthcare, Manufacturing, QI Macros, Service, Six Sigma.
Creating homemade Cp and Cpk templates often results in incorrect values. There are many, many mistakes you might make without realizing. Here are a few examples.
A customer sent me their home grown template for calculating Cp and Cpk and wondered why the QI Macros got such radically different values. It was easy to see from their data that they were using standard deviation, not Sigma estimator (Rbar/d2) to calculate Cp and Cpk. Use Stdev to calculate Pp and Ppk, not Cp and Cpk:

They had run the QI Macros histogram on two columns of data, one measured at 0 degrees and one measured at 90 degrees.
Continue Reading "Cp Cpk Formulas and the Mistakes in Homemade Templates"
Posted by Jay Arthur in Manufacturing, QI Macros, Six Sigma, Statistics.
This month’s issue of Money Magazine discusses the 21 Most Valuable Career Skills. At the top of the list, statistical analysis increasing pay by 6.1%. Right behind statistical analysis is Data Mining at 5.1%. It’s incredibly easy to learn these two skills using QI Macros and Six Sigma.
Also on the list, Customer Service Metrics (4.3%). I have found that the written comments in customer service systems can be easily analyzed using the QI Macros Word Count tool to identify the most common type of call or complaint. Then simple root cause analysis can reduce or eliminate those calls.
Business analysis (3.8%) is easy with QI Macros Control Chart Dashboards.
Continue Reading "Most Valuable Career Skills"
Posted by Jay Arthur in Healthcare, Lean, Manufacturing, QI Macros, Service, Six Sigma.
At this years American Society for Quality World Conference in Milwaukee, winning teams improvement projects were displayed in posters in the exhibit hall. As I did at IHI in December, I took a stroke tally of the types of tools used. Like IHI, the vast majority of tools were line and bar charts, which are the dumbest charts on the planet. Only a few teams out of 36 used control charts, Pareto charts, histograms or fishbones.
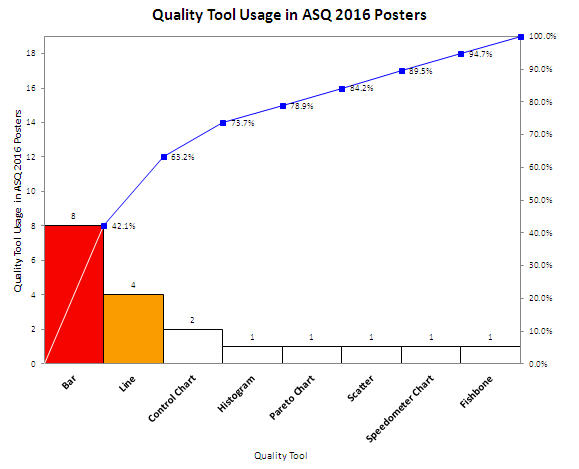
Shouldn’t quality improvement stories should be told with tools of quality, not simple line and bar charts? Shouldn’t we be using charts that went to college and took statistics?
Continue Reading "ASQ 2016 Quality Tool Usage in Poster Presentations"
Posted by Jay Arthur in Healthcare, Manufacturing, QI Macros, Service, Six Sigma.
In this interesting video of How the Economic Machine Works Ray Dalio describes some key principles of economic growth. He has three rules for economic improvement. Rule Three is Do All That You Can To Raise Productivity.
Perhaps the most powerful tools for productivity improvement are Lean Value Stream Mapping and Spaghetti Diagramming. The 15-2-20 Rule says that for every 15 minutes of unnecessary delay removed from a process, a business can double productivity and increase profits by 20 percent.
All you need are sticky notes, a flip chart and an hour or two to identify and remove unnecessary delays and movement from any business process.
Continue Reading "Do All That You Can To Raise Productivity"
Posted by Jay Arthur in Lean, Manufacturing, Service.
I had a breakfast burrito at the Marriott in San Diego last week. I cut it in half and took a bite. I realized there was somthing amiss when I pulled out a strip of plastic. I tried to pull it apart, but it wouldn’t break.
I showed it to the cafe staff and she said: “It looks like an onion.” But a cooked onion would pull apart; the plastic didn’t. I got my money back.
I can imagine that if a machine is cutting onions into strips that it would cut plastic as well. Then the plastic just looks like an onion strip in the egg.
Continue Reading "The Plastic Breakfast Burrito"
Posted by Jay Arthur in Manufacturing, Service, Six Sigma.
The April, 2014 Harvard Business Review has an article about creating a culture of quality. The authors found that a culture of quality will save $13,400 per employee per year. Surveyed participants also said it takes two hours to fix a mistake. Joseph Juran often said that companies lose a quarter (25%) of their revenue finding and fixing mistakes and errors, so this gives us a benchmark and a reason to embrace quality.
“Companies that take a grassroots, peer-driven approach develop a culture of quality. Traditional strategies have little effect.”
Four Factors that Drive Quality
- Leadership – As Deming said: “The aim of superision should be the help people and machines and gadgets do a better job.
Continue Reading "Creating a Culture of Quality"
Posted by Jay Arthur in Lean, Manufacturing, Service, Six Sigma.
In Matthew May’s new book, The Laws of Subtraction (McGraw-Hill 2013), he outlines some key concepts refined from his years with Toyota:
At the heart of every difficult decision lie three tough choices:
- What to pursue versus what to ignore.
- What to leave in versus what to leave out.
- What to do versus what to don’t.
The key is to remove the stupid stuff: anything obviously excessive, confusing, wasteful, unnatural, hazardous, hard to use or ugly. This is the art of subtraction.
Isn’t that the core of Lean?
Continue Reading "The Art of Subtraction"
Posted by Jay Arthur in Lean, Manufacturing, Service.
Last week, Toyota unveiled it’s multimillion dollar system for gather repair reports, complaints and safety concerns from dealerships, internet sites and other sources into one system and mine that data for problems beyond the doors of the factory. The WSJ reported that EVP Shinichi Sasaki said that Toyota had succumbed to ‘Big Company Disease’.
It happens. Big or small, companies shift their focus to bottom-line benefits or growth and drop the ball on quality. But, as I’ve predicted for awhile, Toyota’s quality culture is repairing itself and resuming the quest for quality; now on a global basis.
What are you doing to monitor your quality on a global basis?
Continue Reading "Toyota’s Global Data Mining"
Posted by Jay Arthur in Lean, Manufacturing, Six Sigma.

