Improvement Insights Blog
Cp Cpk Formulas and the Mistakes in Homemade Templates
Creating homemade Cp and Cpk templates often results in incorrect values. There are many, many mistakes you might make without realizing. Here are a few examples.
A customer sent me their home grown template for calculating Cp and Cpk and wondered why the QI Macros got such radically different values. It was easy to see from their data that they were using standard deviation, not Sigma estimator (Rbar/d2) to calculate Cp and Cpk. Use Stdev to calculate Pp and Ppk, not Cp and Cpk:

They had run the QI Macros histogram on two columns of data, one measured at 0 degrees and one measured at 90 degrees. Looking at the histogram you can see that there are two “humps” or distributions. Cp and Cpk are both below 1.0 so you can understand why they were concerned:
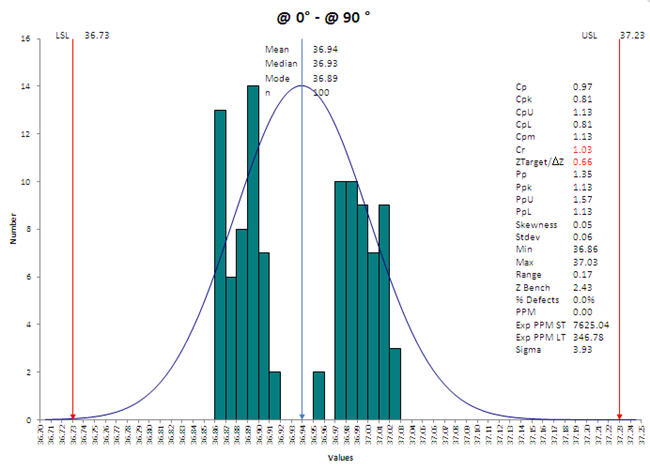
I’m assuming this is some sort of cylindrical part. They might want to move these two measurements to more closely coincide so that the part is more round than oval, but that’s a different question.
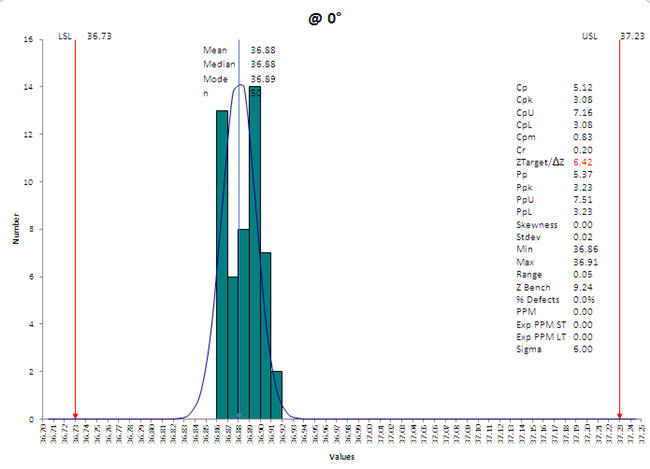
The mistake they made was running the histogram on two measurements, not one. The range between 0-90 degrees was so wide as to distort both Cp and Pp calculations. Running a histogram using just one column delivers the correct answer for both Cp/Cpk and Pp/Ppk. Pp and Ppk are identical to their original calculations. Cp and Cpk are above 3.0 (pretty good)!
This is a common mistake, confusing Pp/Ppk and Cp/Cpk formulas. While Pp and Ppk are easier to calculate, you will need a tool like the QI Macros to calculate Cp and Cpk correctly using Sigma Estimator. You could do it by hand, but wouldn’t that be a waste of your time?

