Improvement Insights Blog
ASQ 2016 Quality Tool Usage in Poster Presentations
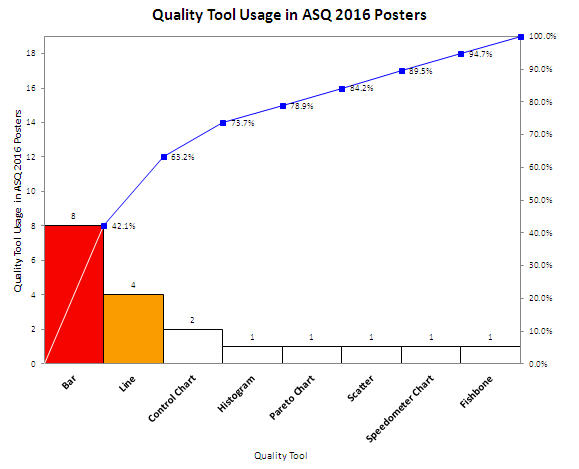
At this years American Society for Quality World Conference in Milwaukee, winning teams improvement projects were displayed in posters in the exhibit hall. As I did at IHI in December, I took a stroke tally of the types of tools used. Like IHI, the vast majority of tools were line and bar charts, which are the dumbest charts on the planet. Only a few teams out of 36 used control charts, Pareto charts, histograms or fishbones.
Shouldn’t quality improvement stories should be told with tools of quality, not simple line and bar charts? Shouldn’t we be using charts that went to college and took statistics?

