Improvement Insights Blog
The Correct Way to Draw a Pareto Chart
I first learned how to draw Pareto charts by hand using engineering paper if you can believe it. Our trainers were very specific about how they were to be drawn. One of the earliest references I can find is Kaoru Ishikawa’s Guide to Quality Control. Here’s the correct way to draw a Pareto chart using data from Ishikawa’s book:
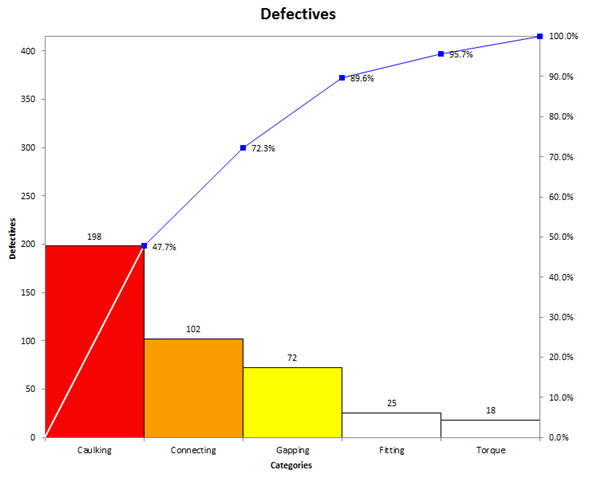
The bars should be touching and the cumulative percentage line should go from corner to corner of the first bar.
Unfortunately, most Pareto charts drawn by computer look like the following one, bars not touching and cumulative line running out of the center of the top of the first bar. This isn’t how it should be done.
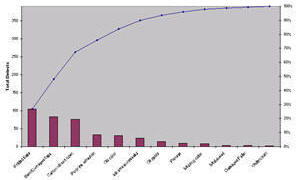
This isn’t the right way to draw a Pareto chart. It’s a primitive attempt, but still incorrect.
If you want people to trust your Six Sigma improvement project, isn’t it time to start drawing Pareto charts the right way?

