Home »
Blog » Data Mining » Page 14
Improvement Insights Blog
Posts tagged "Data Mining"
People often get stuck before the “Analyze” phase of DMAIC because of ugly data.
You can’t analyze data until it is in the right format for analysis.
In this data about medications that might affect patient falls, we have to:
- Transpose the data
- Use Excel’s Text-to-column feature to split the meds into separate cells
- Use QI Macros UnStack Columns tool to get all of the meds into a single column
- Use QI Macros Data Mining Wizard to create a PivotTable and Pareto chart of medications involved in patient falls
You can watch the video below:
Continue Reading "It’s Hard to Do Data Analysis on Ugly Data… Part 2"
Posted by Jay Arthur in Data Mining, Improvement Insights.
Nobody wants to read your spreadsheet! No matter how hard you try to make it pretty, create great labels or whatever, the only person who can read your spreadsheet is a CFO or Excel spreadsheet geek. And the Excel geek is going to tell you 10 ways to make it prettier.
The purpose of data is to provide insights for action, not just report past performance.
How Do I Know That Most Excel Users Try to Make Their Spreadsheets Readable By People?
According to Renu Davi, Sr. Program Manager for Excel, Microsoft tracks how people use Excel. The vast majority of the 650 million users use it for lists and reports.
Continue Reading "Nobody Wants to Read Your Spreadsheet!"
Posted by Jay Arthur in Data Mining, QI Macros, Six Sigma.
This month’s issue of Money Magazine discusses the 21 Most Valuable Career Skills. At the top of the list, statistical analysis increasing pay by 6.1%. Right behind statistical analysis is Data Mining at 5.1%. It’s incredibly easy to learn these two skills using QI Macros and Six Sigma.
Also on the list, Customer Service Metrics (4.3%). I have found that the written comments in customer service systems can be easily analyzed using the QI Macros Word Count tool to identify the most common type of call or complaint. Then simple root cause analysis can reduce or eliminate those calls.
Business analysis (3.8%) is easy with QI Macros Control Chart Dashboards.
Continue Reading "Most Valuable Career Skills"
Posted by Jay Arthur in Healthcare, Lean, Manufacturing, QI Macros, Service, Six Sigma.
You can use Excel’s data formatting, commenting and filtering tools to help visualize and clarify your data.
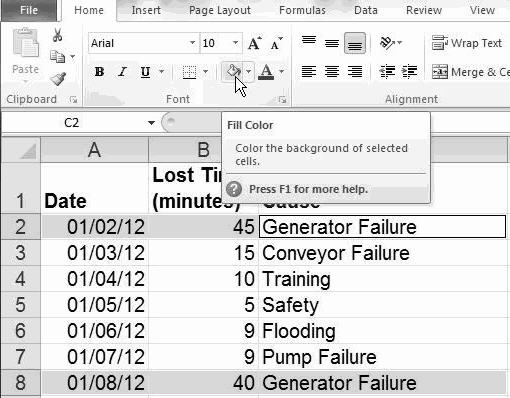
Highlighting: Select cells and click on Home-Fill Color to highlight cells:
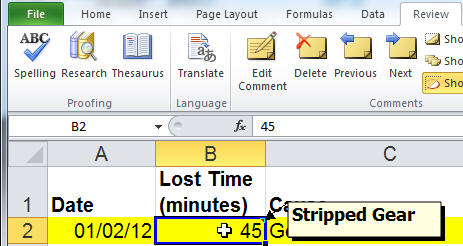
Commenting: To add comments to any cell, click on Data-Insert Comment:
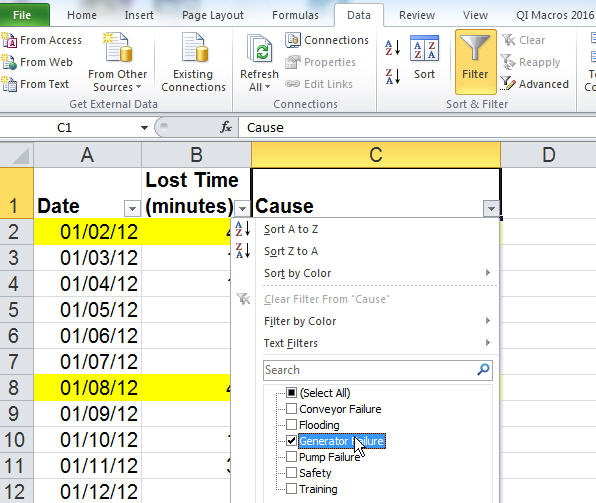
Subset: To select a subset of your data, click on Data-Filter and select the desired content:
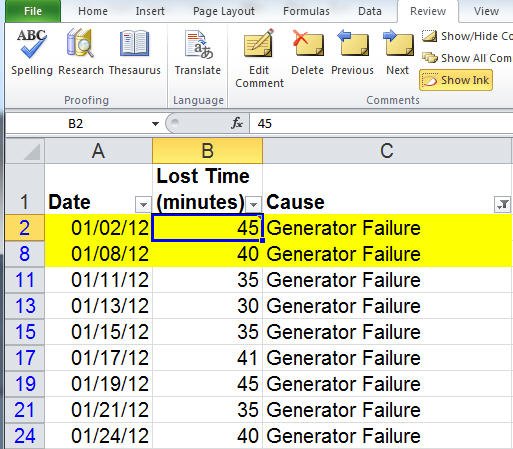
Excel will simplify and streamline your data for ease of analysis:
Excel has many powerful data exploration and visualization tools. Play with them!
Continue Reading "Data Visualization and Exploration In Excel"
Posted by Jay Arthur in Excel, Six Sigma.