Improvement Insights Blog
Nobody Wants to Read Your Spreadsheet!
Nobody wants to read your spreadsheet! No matter how hard you try to make it pretty, create great labels or whatever, the only person who can read your spreadsheet is a CFO or Excel spreadsheet geek. And the Excel geek is going to tell you 10 ways to make it prettier.
The purpose of data is to provide insights for action, not just report past performance.
How Do I Know That Most Excel Users Try to Make Their Spreadsheets Readable By People?
According to Renu Davi, Sr. Program Manager for Excel, Microsoft tracks how people use Excel. The vast majority of the 650 million users use it for lists and reports. How do I know they were made for people? They use Merge and Center to align headings so that people can read them.
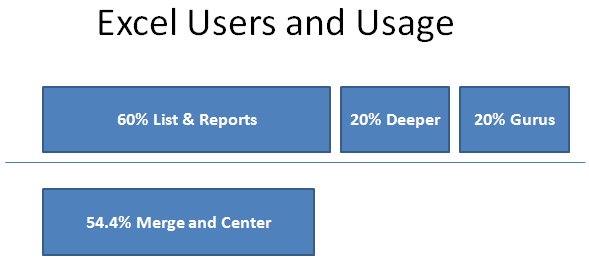
Look at the spreadsheet below. Row 1 uses merged cells. Merged cells are evil! Merged cells cause all kinds of problems when charting, calculating or pivoting, but over half of all Excel workbooks have them.
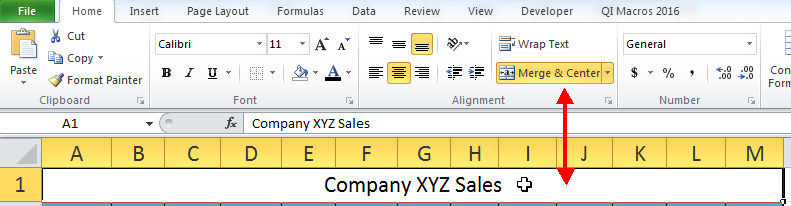
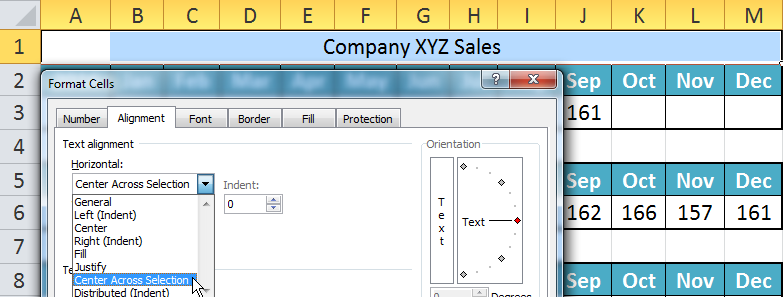
What to do? Use Format Cells – Center Across Selection instead of Merge & Center:
What’s Wrong With Most Spreadsheets? The most common mistake is putting data in horizontal rows like the example below. Then, to make it readable, each year is stacked on top of the next year. Looks pretty right?
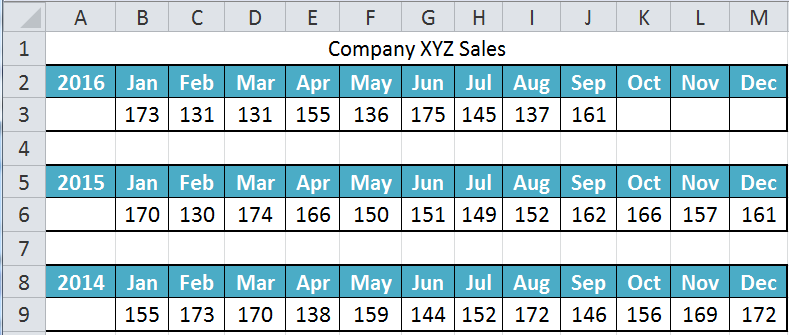
But you can’t chart the data; you can’t Pivot the data; you can’t tell if there are anomalies. And almost everyone will struggle to read it (except you). Is there any actionable data in this sheet? I can’t tell. To begin to make sense of this data, it would be nice to see a chart. But if you chart the data as shown, you get a spaghetti chart. And the series aren’t named correctly because the year is in the wrong row.
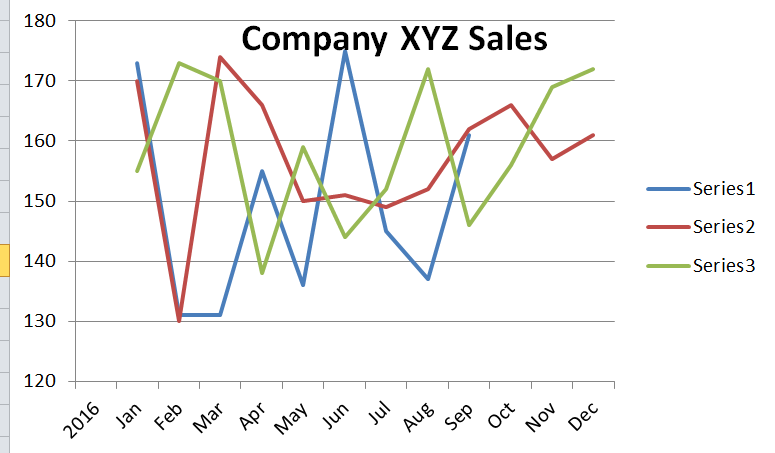
To chart the data, you would need to transpose the data into a single column and convert the dates from a text field, “Jan”, to a real date, “Jan 14”. Then you could chart the data.
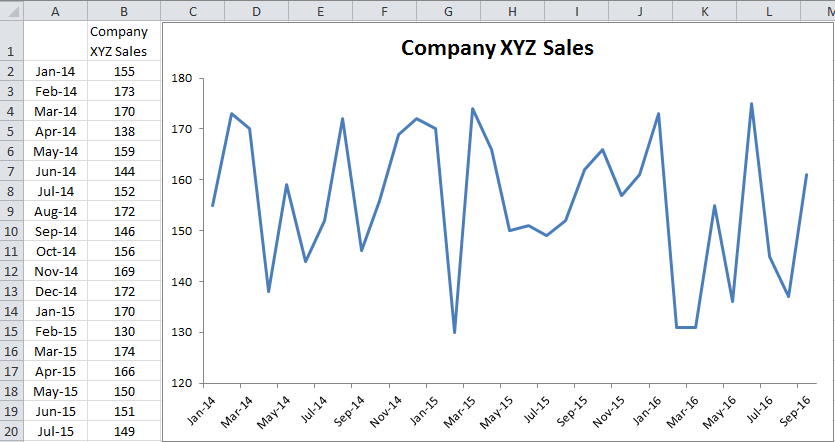
But you can’t really tell if any of these data points are actual signals requiring action or just noise. If, however, you chart the data as a performance chart you can analyze performance:
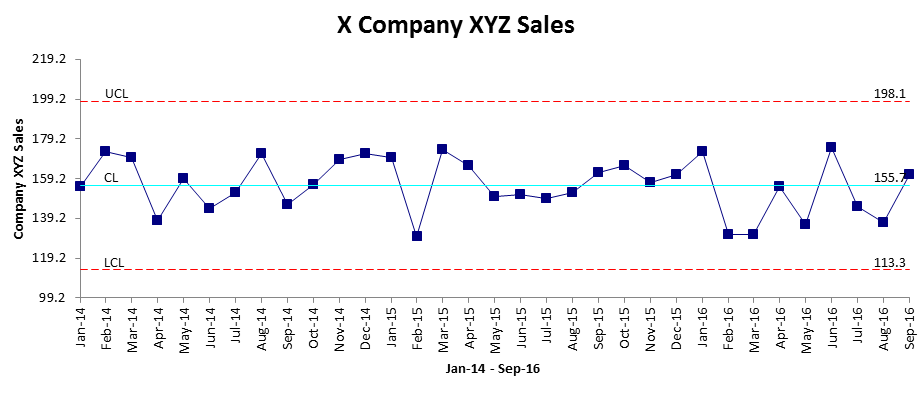
In this case, sales are flat with an average of 155.7. This process is stable and predictable. All of the points are just common variation, not signals. But sales aren’t improving. Is this okay or does it need improvement? What Else Do People Do That Impacts Usability? They insert summaries into their data. In the example below-left, they are summing by quarter and using simple formulas instead of an Excel function – Sum(B2:B4). If you have dates, no inserted summaries and use PivotTables, Excel can group this data for you (below-right).

Nobody Wants to Read Your Spreadsheet! Trying to make a spreadsheet easier for humans to read is a waste of time. Make your data easier for Excel to pivot, analyze and chart. Turn unreadable spreadsheets into charts that provide clarity about performance and deliver insights for action. Stop creating reports that nobody reads. Start creating a business case for improvement.

