Improvement Insights Blog
Reducing Patient Falls – A Case Study
The Joint Commission Journal on Quality and Patient Safety (Feb 2018) has an article entitled “Temporal Trends in Fall Rates with the Implementation of a Multifaceted Fall Prevention Program.” Ouch!
I believe the story could have been told easily with quality improvement tools, so here’s how I’d go about it. First, there are a number of tables (i.e., spreadsheets of performance data) like the one below.
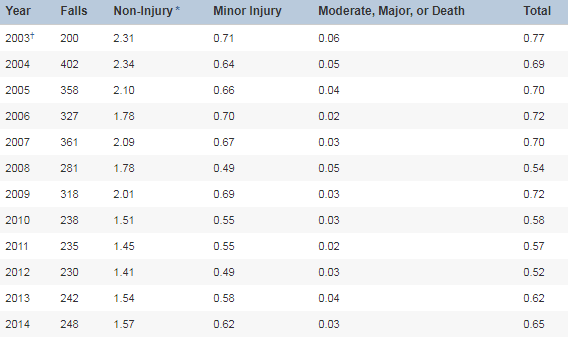
The first year, 2003, had only 200 falls because they started measuring in July. The first full year of measurement was 2004.
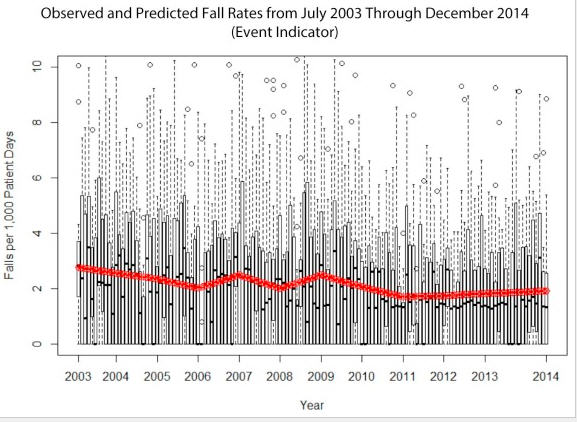
It would be easy to turn these into control charts, but the authors chose a boxplot with a trend line of predicted falls. The boxes and whiskers and outliers are so dense that they make this chart unreadable. In the data visualization world, I’d consider this to be “chart junk.”
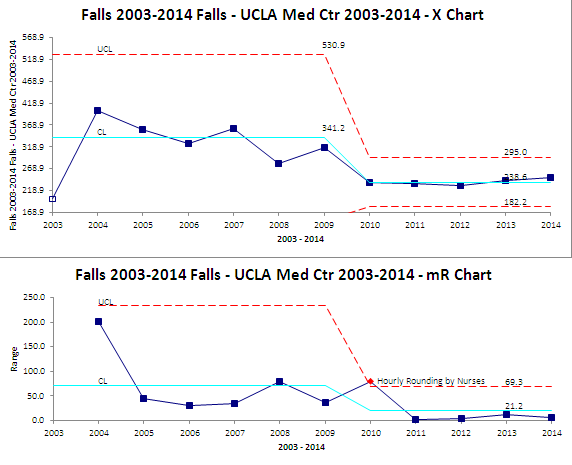
What if we used an XmR chart of falls per year and “ghosted” the first point? A number of improvements from 2004-2009 reduced the rate. Hourly rounding in 2010 resulted in the biggest drop. Subsequent improvements did not seem to affect the falls rate.
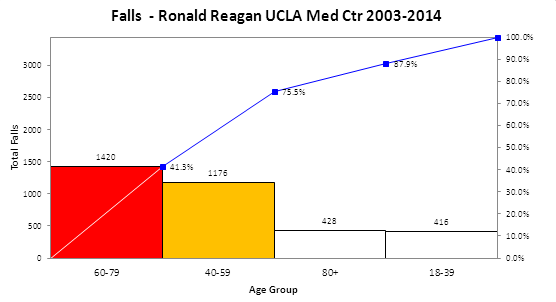
Now we can look at some of the types and locations of falls. Here’s the data. Again, it’s a spreadsheet that’s a bit hard to read.
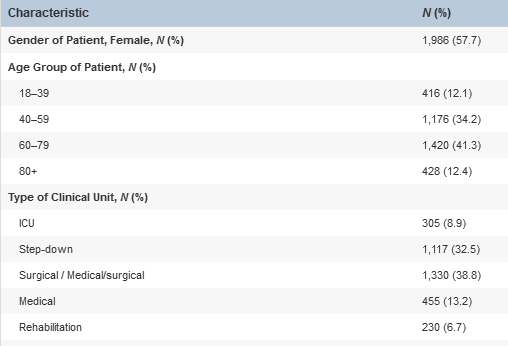
What if we used Pareto charts to narrow the focus? 40-79 year olds are most likely to fall (or there may be fewer 80+ year old patients).
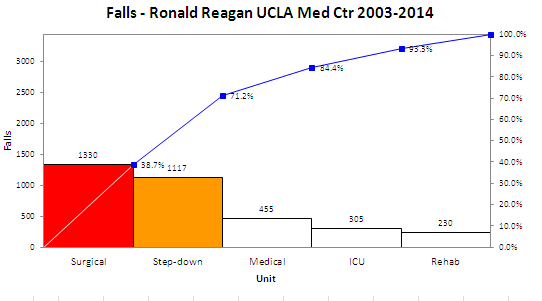
Most falls occur in surgical or step down (between ICU and med/surg) units. Seems like this would be an easy way to laser focus improvements to reduce falls.
Of course, this data is spread over 11 years, so we don’t have the data to analyze recent performance, but it must exist.
Aren’t these charts easier to understand than spreadsheets and box plots? Don’t they tell a better story?
Authors sometimes complicate their analysis for journals as if it’s a requirement for publication. What if we got back to telling improvement stories with a few more charts and a lot less words?

