Home »
Blog » QI Macros » Page 15
Improvement Insights Blog
Latest "QI Macros" Posts
I started wondering, what would the COVID-19 pandemic look like as an improvement story. We have charts about cases and deaths. What might be the root causes and potential countermeasures? Here’s my draft Ishikawa-fishbone root cause analysis diagram and countermeasures. Root causes circled in red.
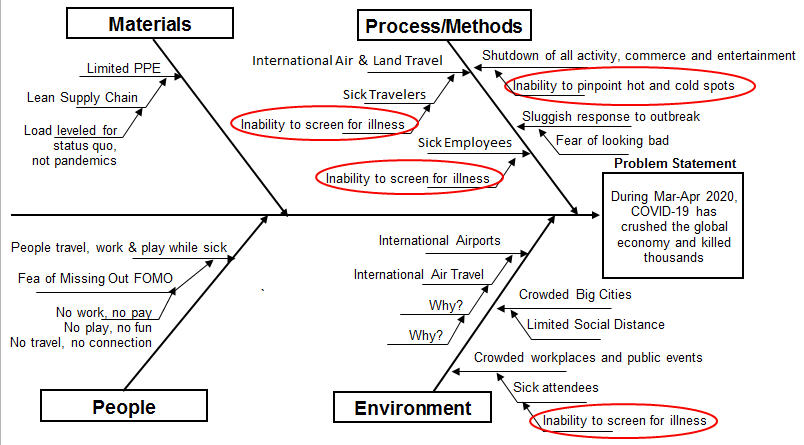
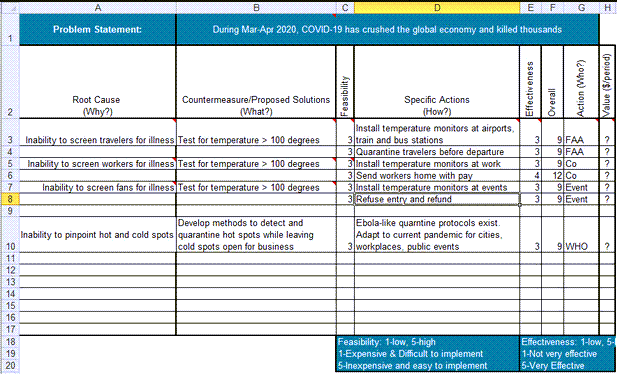
We screen for guns in luggage and knives on passengers, why not temperatures?
As of 4/12/20, NYC accounted for over a third of U.S. COVID-19 cases and almost 50% of deaths. It’s a hot zone. According to one employee, Denver General Hospital has not had a single COVID-19 patient. It’s a cold zone. What are the boundaries of the cold zone?
Continue Reading "COVID-19 Root Cause Analysis and Countermeasures"
Posted by Jay Arthur in Agile Lean Six Sigma, QI Macros, Six Sigma.
While most COVID-19 charts show cumulative cases and deaths, I wondered what would happen if we turned the cumulative data into a daily data and plotted it as a control chart. It is possible to use c or XmR charts for this purpose. Process changes chosen based on runs and trends in the data.
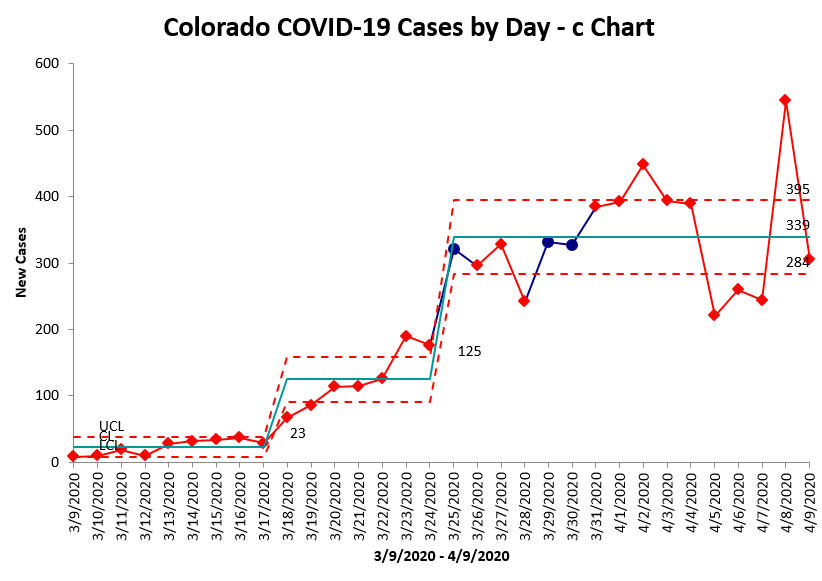
Daily new cases still unstable, but hovering around 339/day. Cases began to rise 3/18. Potentially leveling off 3/26. the date of state “stay-at-home” order.
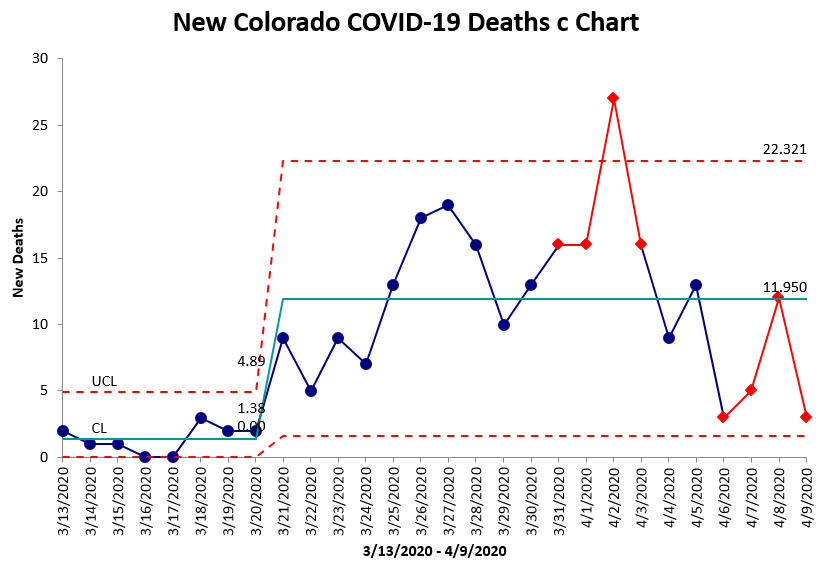
Daily deaths still unstable, but hovering around 12/day. Deaths began rising 3/21, but appear to be stabilizing. Significant spike on 4/2, root cause unknown.
Continue Reading "Colorado COVID-19 Cases and Deaths in Control Charts"
Posted by Jay Arthur in Jay Arthur Blog, QI Macros.
More than 40 people signed up for this webinar, with Jay Arthur demonstrating how to use some of the useful features of QI Macros, as well as some of the new features introduced in recent releases of the software.
Some attendees were familiar with the software and already use it, some had only begun to use it; all were interested in learning new ways that QI Macros can help them with their Agile Lean Six Sigma and Quality Improvement efforts. (You can hear him answering questions and comments typed in by webinar attendees.)
If you saw a feature demonstrated in the webinar that might have been added to QI Macros after the version you’re using (for instance, the Templates Wizard, the Fixed Limit indicator or the automated Process Change Wizard), you may need to purchase an upgrade to bring your QI Macros to the current version.
Continue Reading "4/9/20 QI Macros Webinar"
Posted by Jay Arthur in Data Mining, Excel, QI Macros, Webinar.
One of our QI Macros users offered to share his dashboard of paramedic response during the Seattle area response to COVID-19. His team transported the first COVID patient in America. As you can see, turnaround times (TAT) at the hospital averaged 30 minutes and temperatures spiked in transported patients.
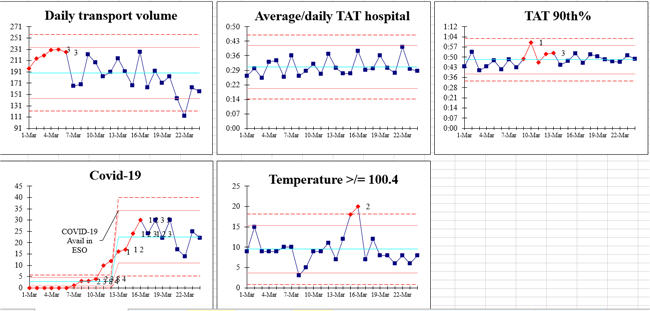
Continue Reading "COVID-19 Paramedic Dashboard 2020"
Posted by Jay Arthur in Healthcare, Jay Arthur Blog, Lean, QI Macros.
Back in 2002, thousands of miles from New York City, I worked with a hospital in Oregon. I was amazed to find that they had staffing data from 9/11 about the up and down for that month. As you can see in this X Chart, absenteeism (understaffing) was lower for each of the four following days, 9/12-15, and then recovered. I have noticed this pattern with COVID-19 as well: a week of paralysis followed by a return to normal. Unfortunately, healthcare workers haven’t had the luxury of downtime when dealing with the new crisis.
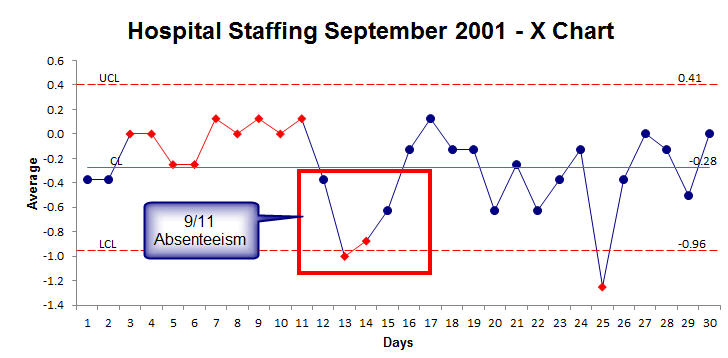
So don’t be surprised if crisis and uncertainty cause you or someone you know to hit the pause button.
Continue Reading "How Crisis Affects U.S. Healthcare Workers"
Posted by Jay Arthur in Healthcare, Jay Arthur Blog, Lean, QI Macros.
If you’ve ever been sick, you know that the only thing you can do is wait it out. Here’s what we’re going to have to do:
“Hi, I’m Jay Arthur, author of “Lean Six Sigma for Hospitals” and the QI Macros [software].
“I know all of you have had some sort of cold or flu or been sick for a while. The day before Thanksgiving in 2014, I had this really heavy cough that came from the darkest recesses of my lungs and I said, “That’s not good.” Then I felt a little worse on Thursday, and on Friday I was diagnosed as having the flu.
Continue Reading "The Economy is Sick"
Posted by Jay Arthur in Healthcare, Improvement Insights, QI Macros.
Out of Work? Need a job? Want to become indispensable to your employer?
Learn the data analysis skills for problem solving (a.k.a. Lean Six Sigma). Do it now. It’s Free!
Click here to get started: www.lssyb.com
“Hi, I’m Jay Arthur, author of “Lean Six Sigma Demystified” and the QI Macros [software].
“I don’t know about you, but right now, I’m staying home because of the directives around COVID-19. I know there’s a lot of people out there who have been displaced and are out of work, and now might be a good time to learn a new skill. I can tell you: being able to do some data analysis that results in problem solving is a skill that every, every, every business wants.
Continue Reading "Learn Data Analysis for Problem Solving"
Posted by Jay Arthur in Agile Lean Six Sigma, Data Mining, Healthcare, Improvement Insights, Lean, Manufacturing, QI Macros, Service, Six Sigma.
More than 60 people signed up for this webinar, with Jay Arthur demonstrating how to use some of the useful features of QI Macros, as well as some of the new features introduced in recent releases of the software.
Some attendees were familiar with the software and already use it, some had only begun to use it; all were interested in learning new ways that QI Macros can help them with their Agile Lean Six Sigma and Quality Improvement efforts. (You can hear him answering questions and comments typed in by webinar attendees.)
If you saw a feature demonstrated in the webinar that might have been added to QI Macros after the version you’re using (for instance, the Templates Wizard, the Fixed Limit indicator or the automated Process Change Wizard), you may need to purchase an upgrade to bring your QI Macros to the current version.
Continue Reading "3/10/20 QI Macros Webinar"
Posted by Jay Arthur in Data Mining, Excel, QI Macros, Webinar.
Sometimes you’ll hear people say that software isn’t necessary for Quality Improvement. Let me demonstrate how much time you’re wasting if you create ONE Pareto chart by hand, instead of using software.
“Hi, I’m Jay Arthur, author of “Lean Six Sigma Demystified” and the QI Macros [software].
“If you’ve listened to any of my Insight videos or seen me present at conferences or [had me] train you in a workshop, you know that I don’t believe you can do Quality Improvement without software. We have to stop doing Quality Improvement the 20th century manual, slow way. We have to start doing it the 21st century way, and we have to start doing it quickly.
Continue Reading "Making Pareto Charts by Hand?"
Posted by Jay Arthur in Agile Lean Six Sigma, Improvement Insights, QI Macros.
At the ASQ Lean Six Sigma Conference in Phoenix this week, Katie Castree with Accumen presented an excellent improvement story about reducing over-collection of blood tubes in a hospital. Here’s the story:
Baseline: 317 extra tubes of blood collected every day (115,705/year)
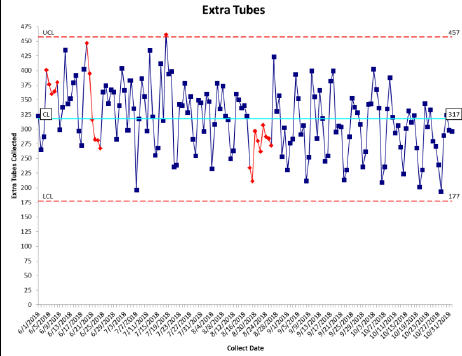
93% of tubes were not used (clinicians thought it was much higher and resisted changing)
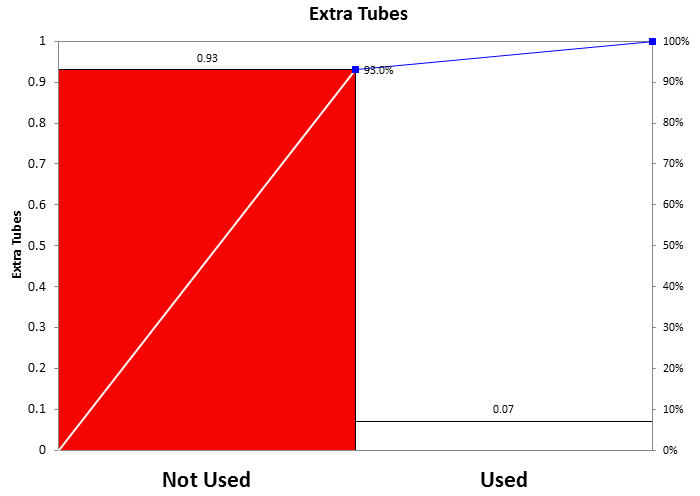
Most of the unused tubes were collected in the Emergency Department (focus on the ED, not the entire hospital).
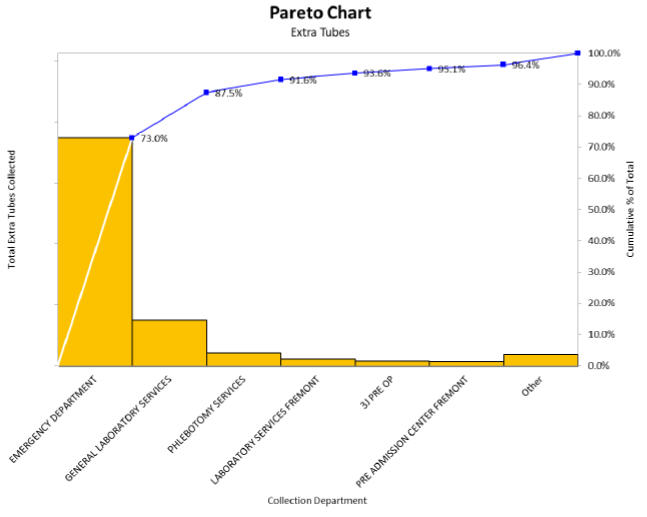
After the countermeasure (not collecting tubes unnecessarily), extra tubes dropped from 317 per day to 118 per day saving $12,335/year and 0.27 FTEs. Over time, extra tubes dropped to only 84 per day, a 74% reduction.
Continue Reading "Reducing Blood Sample Over-Collection"
Posted by Jay Arthur in Agile Lean Six Sigma, Healthcare, Jay Arthur Blog, QI Macros, Six Sigma.