Improvement Insights Blog
COVID-19 Root Cause Analysis and Countermeasures
I started wondering, what would the COVID-19 pandemic look like as an improvement story. We have charts about cases and deaths. What might be the root causes and potential countermeasures? Here’s my draft Ishikawa-fishbone root cause analysis diagram and countermeasures. Root causes circled in red.
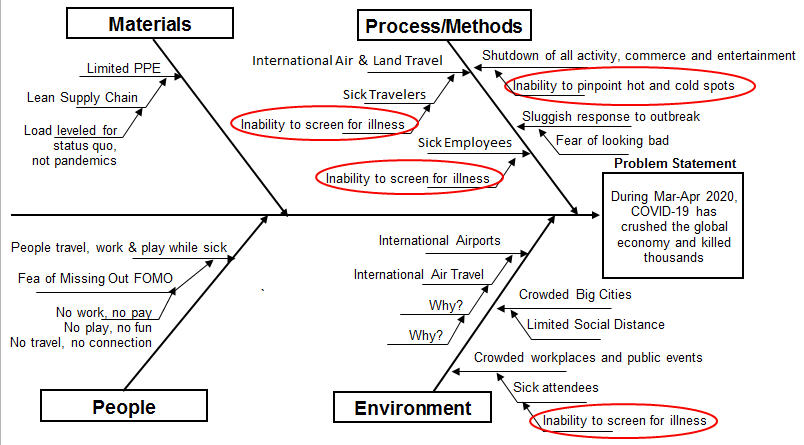
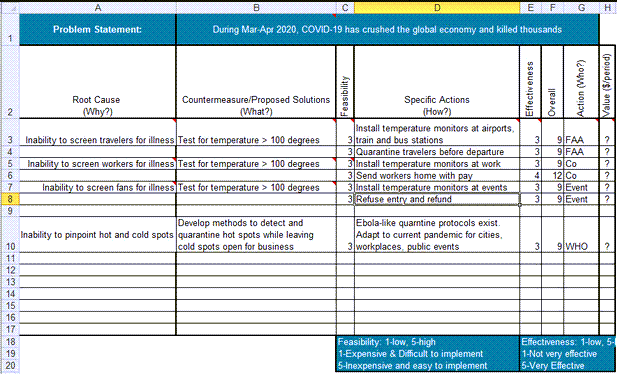
We screen for guns in luggage and knives on passengers, why not temperatures?
As of 4/12/20, NYC accounted for over a third of U.S. COVID-19 cases and almost 50% of deaths. It’s a hot zone. According to one employee, Denver General Hospital has not had a single COVID-19 patient. It’s a cold zone. What are the boundaries of the cold zone? We don’t know. In the future, we will need to quarantine the hot zones and let the cold zones operate as normal. Otherwise the global economy will grind to a halt.
I believe that creative people will have a vaccine ready faster than ever before. This will help develop herd immunity. Meanwhile we need a more targeted way of managing the hot and cold spots. And we need a way to detect and prevent future outbreaks.
Note: Fishbone and countermeasures diagrams created with QI Macros for Excel.

