Home »
Blog » Statistics
Improvement Insights Blog
Posts tagged "Statistics"
Over half the population hates math and statistics. How do we help them embrace the tools of quality?
Download my free ebook, Agile Process Innovation – Hacking Lean Six Sigma for Results.
“Hi, I’m Jay Arthur, author of “Lean Six Sigma Demystified” and QI Macros [software].
“Do you love math and statistics? Maybe not. Half the population does not like math and statistics. That’s one of the reasons I created QI Macros: to automate all that math and statistics so they don’t need to know that. They just get charts or graphs or analysis, right? I don’t want people frustrated by math and statistics.
Continue Reading "Do You Hate Math and Statistics?"
Posted by Jay Arthur in Improvement Insights.
There’s often more than one way to get an answer with statistics.
“Hi, I’m Jay Arthur, author of “Lean Six Sigma For Hospitals” and QI Macros [software].
“The other week we had somebody call in and say, “Can you do XYZ stat?” Well, by that name I didn’t understand what they were talking about, but then I looked up XYZ stat and it was our ABC stat in the QI Macros. Right?
“There’s more than one way to do things in statistics. There’s all kinds of things, all right? I just found out about something called Dixon’s Q and Grubbs’ Outlier Test for small samples… okay.
Continue Reading "More than One Way to Ken a Stat"
Posted by Jay Arthur in Improvement Insights.
A statistician using a bar chart is like a surgeon using a butter knife. Here’s why:
Download my free ebook Agile Process Innovation.
“Hi, I’m Jay Arthur, author of “Lean Six Sigma Demystified” and QI Macros [software].
“I was recently perusing the American Statistical Association’s magazine, and they had some posters that were done by kids in K through 12. This one was an analysis of what kind of charts and graphs are used in poster presentations at statistical conferences. They found that more often than not, the winners had bar charts, and that bar charts were very popular because of their simplicity.
Continue Reading "Statisticians Using Bar Charts"
Posted by Jay Arthur in Improvement Insights.
People have to know the WHY in order to learn something more effectively.
Download my free ebook Agile Process Innovation.
“Hi, I’m Jay Arthur, author of “Lean Six Sigma Demystified” and “Agile Process Innovation” as well as QI Macros [software].
“I was working on [building] a tool called Multinomial Logistic Regression (if that doesn’t choke you up I don’t know what would), but it’s a way of starting to forecast things; people asked for it so I built it. I was telling my wife about this and she said, “Oh, and you tell me you’re not a statistician!”
Continue Reading "People Have to Know the WHY"
Posted by Jay Arthur in Improvement Insights.
In my 30+ years in quality improvement, I finally got to use basic statistics to save millions of dollars. And it was easy. Here’s how:
“Hi, I’m Jay Arthur, author of “Lean Six Sigma Demystified” and QI Macros [software].
“I recently had a chance to help a food company that had frozen meats of various kinds – you know, poultry and so on – and they’d had a chemical spill. Well, what the USDA wanted them to do was prove that it had not affected their food and so somehow I got called in to help with that.
Continue Reading "My First Statistics Project"
Posted by Jay Arthur in Improvement Insights.
Joseph Juran felt that the American Society for Quality focused too heavily on statistics and not enough on quality as a management discipline.
“Hi, I’m Jay Arthur, author of “Lean Six Sigma Demystified” and QI Macros [software].
“Again, I was looking through my old Quality Progress [issues] about Juran, and in here he said he was very dissatisfied with the statistical orientation of the American Society for Quality. He thought there was too much emphasis on that. He did think one of the biggest barriers to anything is just plain old resistance to change, and an interesting thing in this article [was that] people thought that the whole part of Total Quality Management… they thought that Deming was really “Mr.
Continue Reading "Juran vs ASQ Focus on Statistics"
Posted by Jay Arthur in Improvement Insights.
Shunryū Suzuki said there are four kinds of horses: excellent, good, poor and bad horses. When it comes to statistics, the bad horse may be the best horse. Here’s why:
“Hi, I’m Jay Arthur, author of “Lean Six Sigma Demystified” and QI Macros [software].
“Shunryū Suzuki said there are four kinds of horses: Excellent ones, good ones, poor ones and bad ones. Now everybody wants to be the excellent horse or the good horse, but nobody wants to be the dead-last, bad horse. He suggests that the bad horse has to work extra hard to learn how to run, to learn how to do things, right?
Continue Reading "What Kind of Statistical Horse Are You?"
Posted by Jay Arthur in Improvement Insights, Jay Arthur Blog.
SPC software companies keep trying to gain some edge by tweaking the formulas for various statistics, but is the quest for the next decimal place of precision useful? If you’re trying to send a rocket to Mars? Absolutely. If you’re trying to tune up a business process, not really. Here’s why.
“Hi, I’m Jay Arthur, author of “Lean Six Sigma Demystified” and QI Macros [software]. I’m going to talk to you about what I call The Next Decimal Place.
“Because I’ve been in the software business, [I’ve seen] people and try and change formulas. Let’s say it’s Cp and Cpk.
Continue Reading "The Next Decimal Place"
Posted by Jay Arthur in Improvement Insights, Statistics.
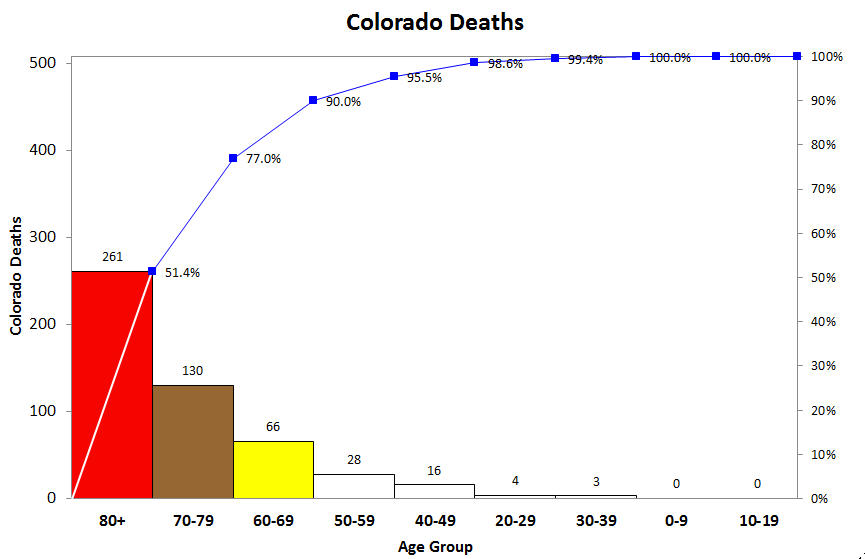
Since 90% of deaths are among those over 60, perhaps the best countermeasure is to require those of us over 60 (me for example) to stay home. Most of us are retired anyway. Let others go back to work.
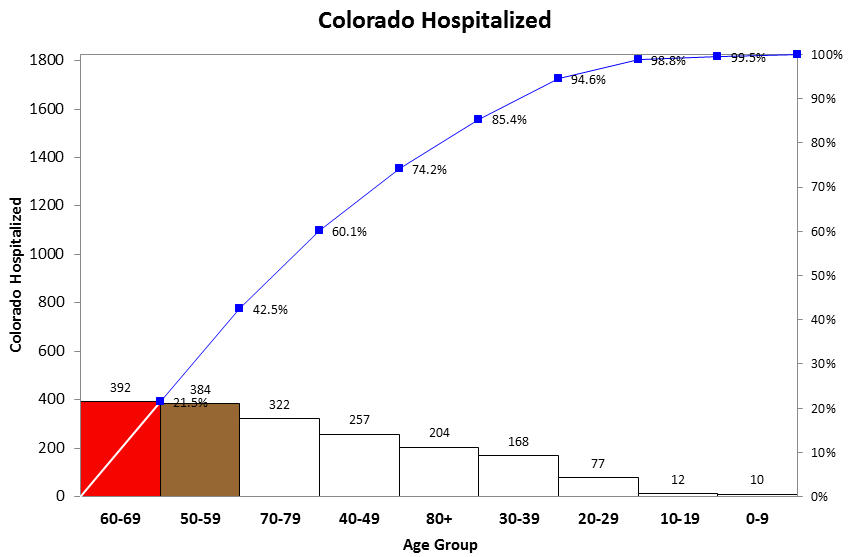
Approximately 51% of Colorado hospitalizations involve people 60-80+, 75% of people over 50. Another reason to ask seniors like myself to stay at home even as the economy reopens. This will help reduce the load on hospitals.
Continue Reading "Colorado Deaths by Age Group"
Posted by Jay Arthur in QI Macros, Six Sigma.
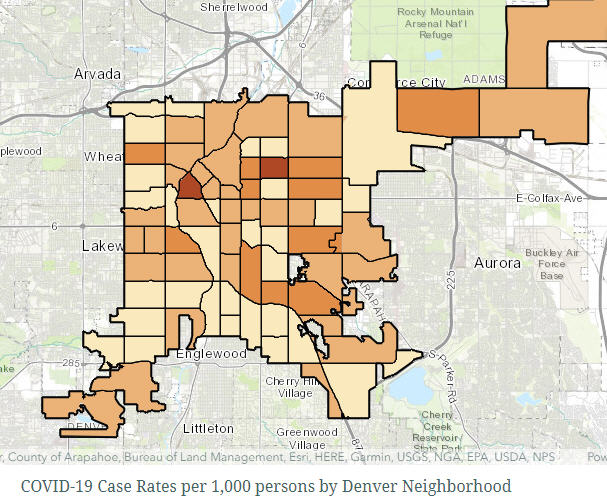
There are COVID-19 hot spots and cold spots. How do we keep the cold spots open and detect and quarantine warming spots? Maybe statistical process control can help.
“Hi, I’m Jay Arthur, author of “Lean Six Sigma for Hospitals” and QI Macros [software].
“Back in the mid 1800s there was a cholera outbreak in London, and John Snow (not of Game of Thrones, but Dr. John Snow) said, “I think there’s a pattern here.” He went out and figured out that everybody who had cholera was getting water from the Broad Street pump. Back then, there was no indoor running water so you had to take your pail, go out to the pump and get your water for your home or your business or your restaurant.
Continue Reading "Cholera and COVID-19 Hot Spot Detection and Quarantine"
Posted by Jay Arthur in Improvement Insights, Six Sigma.