Daylight Savings Time – Six Sigma Project
Does Daylight Savings Time save us anything, or is it costing lives?
Continue Reading "Daylight Savings Time – Six Sigma Project"
Does Daylight Savings Time save us anything, or is it costing lives?
Continue Reading "Daylight Savings Time – Six Sigma Project"
In the book, The Case Against Education: why the Education System is a Waste of Time and Money, author Bryan Caplan argues that, beyond reading, writing and basic ‘rithmatic, “most of what people learn in high school and college is unnecessary and quickly forgotten.”
I would argue that the same is true of Six Sigma; most of what people learn is unnecessary and quickly forgotten.
Peter Coy’s book review in Bloomberg BusinessWeek (January 22, 2018), states that many students struggle with algebra and drop out. City University of New York colleges are “experimenting with alternatives to conventional math because it’s a ‘killing field’ for many students,” says Chancellor James Milliken.
No matter what you do or what you say, there’s a hidden “metamessage” back to yourself.
What metamessages have you told yourself about Lean Six Sigma?
Continue Reading "What are You Secretly Telling Yourself About Lean Six Sigma?"
The Joint Commission Journal on Quality and Patient Safety (Feb 2018) has an article entitled “Temporal Trends in Fall Rates with the Implementation of a Multifaceted Fall Prevention Program.” Ouch!
I believe the story could have been told easily with quality improvement tools, so here’s how I’d go about it. First, there are a number of tables (i.e., spreadsheets of performance data) like the one below.
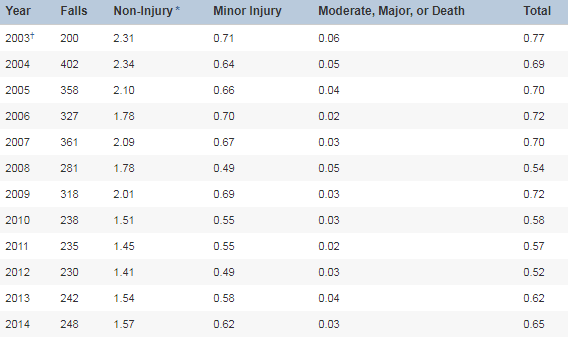
The first year, 2003, had only 200 falls because they started measuring in July. The first full year of measurement was 2004.
It would be easy to turn these into control charts, but the authors chose a boxplot with a trend line of predicted falls.
Are you wasting time in Six Sigma on unnecessary steps?
Here’s how to kick start your improvement efforts.
If you’re not getting the results you want from Six Sigma, there might be a problem in the development of your projects.
Here are some of the mistakes I see in Six Sigma projects.
I believe we are teaching people things they don’t need to know to solve problems they don’t have to impress people they don’t like.
You don’t have to know everything about statistics to do Six Sigma projects. What you need to know adheres to the 4/50 Rule: 4% of the knowledge will deliver over 50% of the results.
And if you automate the formulas and decision trees using QI Macros, you can collapse the learning curve in such a way that “No Belts” can go from zero to hero in a matter of hours. Here’s how:
Remember how you learned things when you were a kid? That’s not how anyone teaches Lean Six Sigma, but it could be.
Continue Reading "Show-Do-Know – The Secret to Accelerated Learning"

KnowWare International, Inc.
2696 S. Colorado Blvd., Ste. 555
Denver, CO 80222 USA
Toll-Free: 1-888-468-1537
Local: (303) 756-9144
