At this years American Society for Quality World Conference in Milwaukee, winning teams improvement projects were displayed in posters in the exhibit hall. As I did at IHI in December, I took a stroke tally of the types of tools used. Like IHI, the vast majority of tools were line and bar charts, which are the dumbest charts on the planet. Only a few teams out of 36 used control charts, Pareto charts, histograms or fishbones.
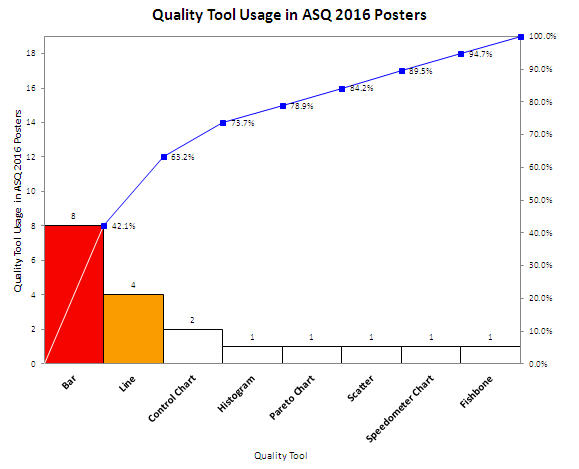
Shouldn’t quality improvement stories should be told with tools of quality, not simple line and bar charts? Shouldn’t we be using charts that went to college and took statistics?
Continue Reading "ASQ 2016 Quality Tool Usage in Poster Presentations"
Posted by Jay Arthur in Healthcare, Manufacturing, QI Macros, Service, Six Sigma.
In his speech Sunday at IHI, Don Berwick called for everyone to “recommit to improvement science” (step 5 in ERA 3 of healthcare transformation).
He sounded annoyed with the lack of use of Lean Six Sigma tools and methodologies.
I understand his frustration. I was there in 2006 when he asked everyone to “pledge allegiance to science and evidence.”
Over the years, I’ve done a stroke tally of the quality tools used in IHI poster presentations.
I gave each poster one checkmark for each type of tool used.
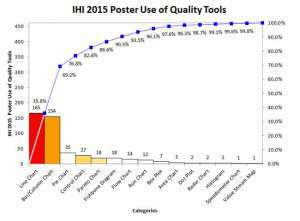
Sadly, even with all of the emphasis on control charts, Pareto charts and other tools of quality, they are used rarely in poster presentations.
Continue Reading "IHI 2015 Poster Use of Quality Tools"
Posted by Jay Arthur in Healthcare, QI Macros, Six Sigma.