Home »
Blog » Page 64
Improvement Insights Blog
Latest Posts
At ASQ LSS Conference in Phoenix, I heard an interesting presentation on digital transformation. Ben Lavoie of Anheuser-Busch asked:
How can LSS Stay relevant in a Digitally Transformed world that thrives on real-time changes?
Bad news: Need for real-time will disrupt DMAIC – leadership teams have no patience for delayed analysis and decision making
Good news: Still need people
Great news: Digital tools need LSS to solve the right problems
I think this speaks to the need for Agile Lean Six Sigma.
Ben also mentioned DevOps, how companies are integrating IT with operations in a continuous feedback loop:

I think if we substitute PDCA for the left loop and link it to operations feedback, we can get the same real-time results with Six Sigma.
Continue Reading "DevOps and QualOps"
Posted by Jay Arthur in Jay Arthur Blog.
At the ASQ Conference in Phoenix, and got some wonderful comments from one of the attendees who uses QI Macros:
Continue Reading "Testimonial from ASQ Phoenix"
Posted by Jay Arthur in Jay Arthur Blog.
In the book, The Case Against Education: why the Education System is a Waste of Time and Money, author Bryan Caplan argues that, beyond reading, writing and basic ‘rithmatic, “most of what people learn in high school and college is unnecessary and quickly forgotten.”
I would argue that the same is true of Six Sigma; most of what people learn is unnecessary and quickly forgotten.
Peter Coy’s book review in Bloomberg BusinessWeek (January 22, 2018), states that many students struggle with algebra and drop out. City University of New York colleges are “experimenting with alternatives to conventional math because it’s a ‘killing field’ for many students,” says Chancellor James Milliken.
Continue Reading "Six Sigma Formulas Cause Math Phobias"
Posted by Jay Arthur in Improvement Insights, QI Macros, Six Sigma.
No matter what you do or what you say, there’s a hidden “metamessage” back to yourself.
What metamessages have you told yourself about Lean Six Sigma?
Continue Reading "What are You Secretly Telling Yourself About Lean Six Sigma?"
Posted by Jay Arthur in Improvement Insights, QI Macros, Six Sigma.
The Joint Commission Journal on Quality and Patient Safety (Feb 2018) has an article entitled “Temporal Trends in Fall Rates with the Implementation of a Multifaceted Fall Prevention Program.” Ouch!
I believe the story could have been told easily with quality improvement tools, so here’s how I’d go about it. First, there are a number of tables (i.e., spreadsheets of performance data) like the one below.
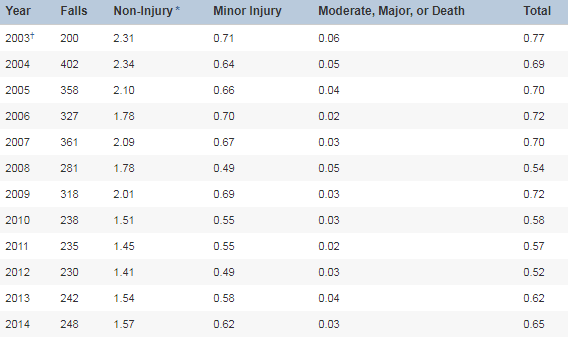
The first year, 2003, had only 200 falls because they started measuring in July. The first full year of measurement was 2004.
It would be easy to turn these into control charts, but the authors chose a boxplot with a trend line of predicted falls.
Continue Reading "Reducing Patient Falls – A Case Study"
Posted by Jay Arthur in Healthcare, Jay Arthur Blog, QI Macros, Six Sigma.
I fell in love with Lean Six Sigma almost 30 years ago…but it takes some work to stay in love with Lean Six Sigma.
Are you willing to do what it takes to make Lean Six Sigma your Valentine?
Continue Reading "Have You Fallen In Love With Lean Six Sigma?"
Posted by Jay Arthur in Improvement Insights, Lean, QI Macros, Six Sigma.
I have been thinking for some time that someone would come along, start buying up hospitals and forcing them to adopt the Lean principles of Amazon and Six Sigma to achieve the “science and evidence” that Don Berwick has been challenging the IHI to adopt.
Warren Buffet has the money, but usually invests in “well-run” companies, not ones in trouble. An estimated half of all hospitals are in financial trouble (often because of the lack of Lean Six Sigma).
Bezos and Amazon have the operational efficiency needed in virtually all healthcare environments.
Dimon has a big bank.
They are all worried about the quality of healthcare and the rising costs.
Continue Reading "Hospital Costs a “Hungry Tapeworm on U.S. Economy” says Warren Buffett"
Posted by Jay Arthur in Healthcare, Lean, QI Macros, Six Sigma.
I started using TurboTax to do my taxes years ago. I used to gather up my 1099s and W-2 and everything else and spend a whole day doing my taxes. Your taxes may not be as complicated as mine, but think of these forms as “work in process” (WIP). I was doing them in a big batch just before the filing deadline.
Then I started using a Lean approach. Whenever a W-9 or 1099 arrives in the mailbox, I input it into the software. By mid-March when the business taxes are finished, everything is in and my taxes are ready to file.
Continue Reading "Using Lean to Do Your Taxes"
Posted by Jay Arthur in Lean, QI Macros.
Are you wasting time in Six Sigma on unnecessary steps?
Here’s how to kick start your improvement efforts.
Continue Reading "Are You Wasting Time in Six Sigma?"
Posted by Jay Arthur in Improvement Insights, Lean, Six Sigma.

