Home »
Blog » Six Sigma » Page 26
Improvement Insights Blog
Latest "Six Sigma" Posts
A QI Macros customer recently asked: ” What is a reasonable and productive ratio of Lean or Six Sigma expert (LSSBB, for example) to staff for a healthcare organization that is starting the journey?”
The general consensus I can find online about Six Sigma belts/employees is:
1 BB/100 employees
3 GB/100 employees
I think these numbers are designed to keep Six Sigma training companies in business.
Depending on the size of a Medical center, you could use one BB and some GBs to get started. You can’t fix everything all at once, so one BB ramrodding a handful of GBs to solve key problems would be a good start.
Continue Reading "How Many Green and Black Belts Do You Need?"
Posted by Jay Arthur in Lean, Service, Six Sigma.
This video suggests that 9 out of 10 Americans think that income should be more evenly distributed.
Unfortunately, Vilfredo Pareto found over a century ago that 20% of the people have 80% of the wealth. He felt that even if it was redistributed it would soon fall back to the 80/20 distribution.
Pareto’s Rule is a power law which means that 4% of Americans should hold 64% of the wealth and 1% of Americans should hold 50% of the wealth. According to this video, the top 1% only has 40%. They also pay 40% of the taxes. The bottom 40% of Americans pay no taxes.
Continue Reading "Pareto’s Rule in Wealth Distribution"
Posted by Jay Arthur in Six Sigma.
In this video, Malcomb Gladwell describes the quest for the perfect spaghetti sauce. While one company tried to optimize smooth Italian-style spaghetti sauce, another company discovered that customers wanted chunky sauce and stole the show.
http://www.ted.com/talks/malcolm_gladwell_on_spaghetti_sauce.html
DOE can optimize a product, but may not satisfy your customer’s needs.
In this case, if you asked a customer what they wanted in a spaghetti sauce, they couldn’t tell you (Voice of the Customer). The company tried all kinds of variations in their sauce (spicy, thick, thin, chunky, smooth) and tested them with customers. Spicy and chunky had significant showings. Sometimes you have to listen to the “Stomach of the Customer” (SOC).
Continue Reading "Design of Experiments May Not Satisfy Customers"
Posted by Jay Arthur in Six Sigma.
In a matter of months, an NC dermatology group boosted insurance coding accuracy saving $65,000.
http://www.msochealth.com/lean-six-sigma-dermatology-practice/
While most of the healthcare quality focus is on hospitals, there’s a huge opportunity to make doctor’s offices more effective and efficient. In this case, better coding results in faster payment of insurance claims. Offices can use Lean to reduce patient wait times and increase volume resulting in more revenue and better patient care.
Continue Reading "Dermatology Group Boosts Coding Accuracy from 65.4% to 91.7%"
Posted by Jay Arthur in Lean, Service, Six Sigma.
My wife ordered a set of monogrammed bath robes for our daughter and son-in-law from RedEnvelope. When they arrived, she checked them (unnecessaryinspection)…no monograms.
So she called (rework) and they told her to keep the two unmonogrammed ones (waste) and they would send two monogrammed ones.
A couple of days later, we did get two monogrammed bath robes (rework). The next day we got two more and the day after that we got two more (waste and rework). When we called (rework), they said, don’t return them because they’ve been monogrammed already.
So now, we have eight robes for the price of two.
Continue Reading "Why Retailers Lose Money"
Posted by Jay Arthur in Jay Arthur Blog, Lean, Service, Six Sigma.
Dr. Richard J. Albin, creator of the PSA test for prostate cancer, says that the devastating consequences treatments including surgery and radiation therapy caused:
- 5,000 deaths soon after surgery
- up to 70,000 serious complications
- 50% had persistent blood in their semen
- up to 300,000 suffered impotence, incontinence or both.
He now calls the widespread use of the PSA test a “Public Health Disaster.” As a result of these findings, the U.S. Preventive Services Task Force will recommend that healthy men no longer receive PSA testing.
Unnecessary tests and treatments of all kinds are estimated to cost $250 Billion in the U.S.
Continue Reading "PSA Test – a Public Health Disaster"
Posted by Jay Arthur in Lean, Service, Six Sigma.
The March 2011 Wired magazine article identifies a new trend in manufacturing: insourcing. An MFG.com survey found that 19% of companies had brought all or part of their manufacturing back to North America. US manufacturing added 136,000 jobs in 2010, the first increase since 1997.
While many small to medium sized businesses moved their manufacturing to China in the early part of the last decade, many are finding benefits from moving production back to the USA:
- Rising labor costs in China are making the USA more cost competitive. China wages more than doubled between 2002-2008.
- Sheer distance “remains an intractable problem.”
Continue Reading "Insourcing Manufacturing"
Posted by Jay Arthur in Six Sigma.
Last week, Toyota unveiled it’s multimillion dollar system for gather repair reports, complaints and safety concerns from dealerships, internet sites and other sources into one system and mine that data for problems beyond the doors of the factory. The WSJ reported that EVP Shinichi Sasaki said that Toyota had succumbed to ‘Big Company Disease’.
It happens. Big or small, companies shift their focus to bottom-line benefits or growth and drop the ball on quality. But, as I’ve predicted for awhile, Toyota’s quality culture is repairing itself and resuming the quest for quality; now on a global basis.
What are you doing to monitor your quality on a global basis?
Continue Reading "Toyota’s Global Data Mining"
Posted by Jay Arthur in Lean, Manufacturing, Six Sigma.
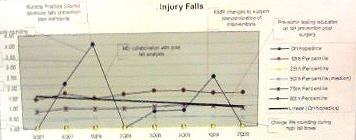
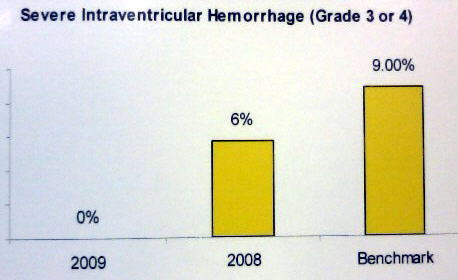
Last week, we exhibited at the Magnet conference for nursing quality. Every healthcare quality conference has posters about improvement projects: Magnet, NAHQ, and IHI. What struck me about these posters was the shortage of quality tools like control charts, pareto charts and fishbone diagrams. Those posters using charts often used the incorrect type of chart for the data.
Here’s an example. This chart has so many lines on it, how can you tell what story they are trying to tell?
Here’s an example using a bar chart (instead of a line graph) and the dates are in reverse order:
Here’s another bar chart with the dates in the correct order, but again, time series charts like this one should be shown as a line, run or control chart.
Continue Reading "Magnet Improvement Posters"
Posted by Jay Arthur in Six Sigma.
BusinessWeek Sept. 20-26, 2010 calls UPS managers “efficiency freaks.” USP began equiping trucks with sensors for everything from brake pad wear to engine efficiencies. This data has helped reduce gas consumption by 25 gallons per year per truck.
Doesn’t sound like much until you realize that UPS has an estimated 95,000 vehicles which means saving almost 2,500,000 gallons per year. Multiply that by $2.50/gallon to get a $6+ million dollar savings. And it makes for a greener planet.
Maybe we could all benefit from more “efficiency freaks.”
Continue Reading "UPS Efficiency Freaks"
Posted by Jay Arthur in Service, Six Sigma.