Improvement Insights Blog
Electrical Outages Improvement Story
Jeremy Singer-Vine publishes a Data Is Plural newsletter about available data sets. I took the U.S. & Canada power outage data from 2018 and used it with QI Macros Data Mining Wizard to create an improvement project.
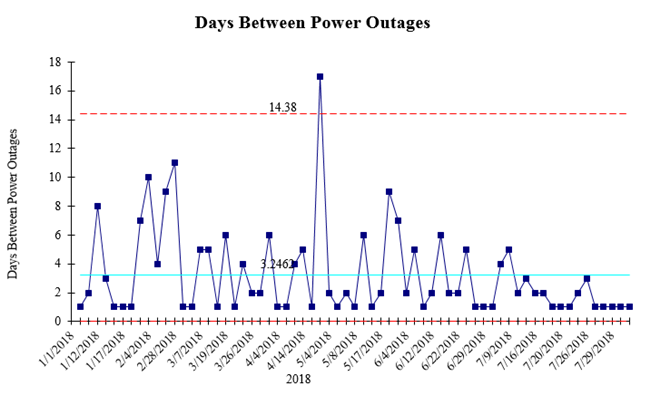
I used a g Chart of time between power outages. Averaging a little over 3 days between outages.
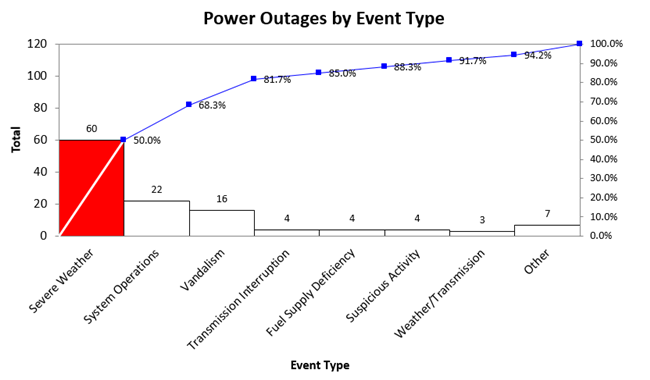
Then, the Data Mining Wizard found the most common cause of outages to be weather. But look at number two: operations. That’s something that could be fixed. Vandalism could also be prevented.
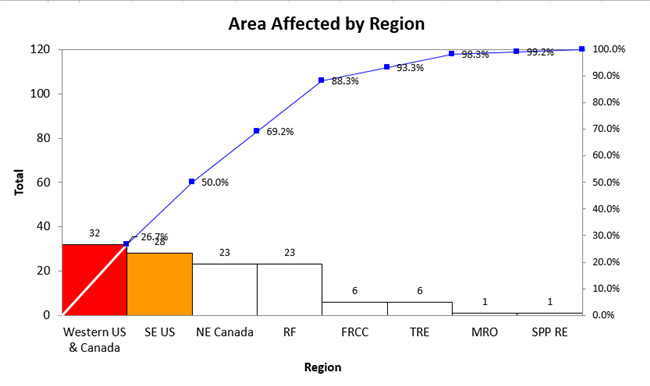
Next, where are outages most likely to occur:
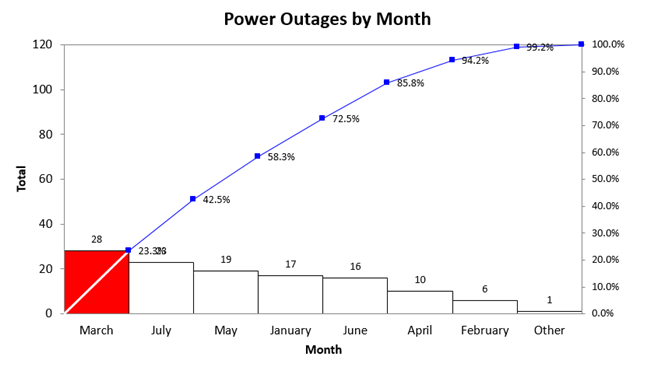
And what month? Readiness months: March-July.
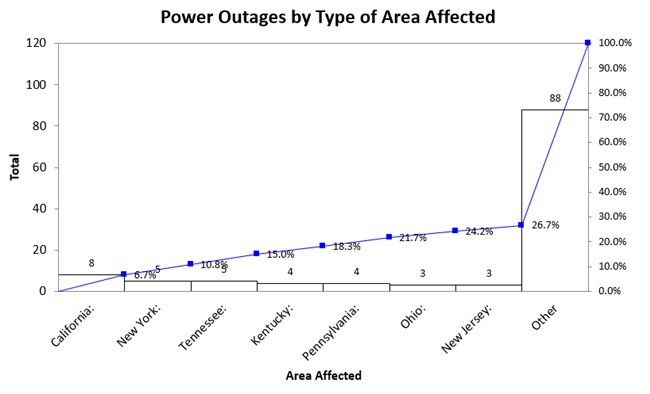
What about by state? No Pareto pattern here, but interesting.
Who knows? There might even be a way to prevent all kinds of outages.
When I was trained by Florida Power and Light, they mentioned that they had found ways to waterproof connections (important in Florida). Tree frogs got into transformers and fried them during the wet season. Putting screens in the transformers kept the frogs out and the air in.
Transmission poles on back country curves tended to be knocked down repeatedly on Friday or Saturday nights after the bars closed.Moving the poles to the inside of the curve instead of the outside solved the problem.
Power outages are a hassle for everyone. Let’s create a Hassle-Free America.

