Improvement Insights Blog
Magnet Improvement Posters
Last week, we exhibited at the Magnet conference for nursing quality. Every healthcare quality conference has posters about improvement projects: Magnet, NAHQ, and IHI. What struck me about these posters was the shortage of quality tools like control charts, pareto charts and fishbone diagrams. Those posters using charts often used the incorrect type of chart for the data.
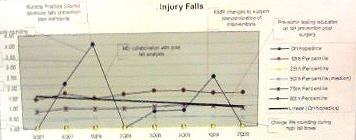
Here’s an example. This chart has so many lines on it, how can you tell what story they are trying to tell?
Here’s an example using a bar chart (instead of a line graph) and the dates are in reverse order:
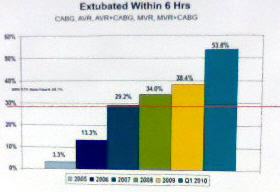
Here’s another bar chart with the dates in the correct order, but again, time series charts like this one should be shown as a line, run or control chart. I worry that there is a lot of variation hidden by lumping every year’s data into one bar. It’s obviously improving, but I’d like to see the steps.
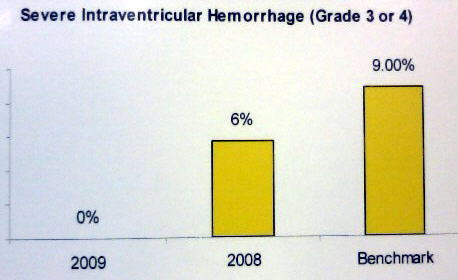
Here’s another bar chart. How can you tell anything from this chart without a lot of study?
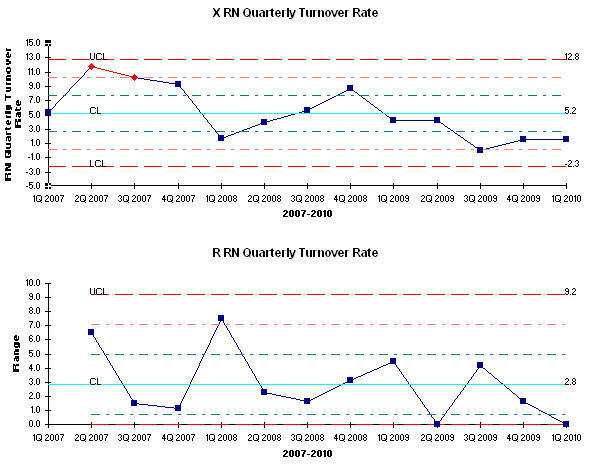
The following chart shows what looks like a nice downward trend.
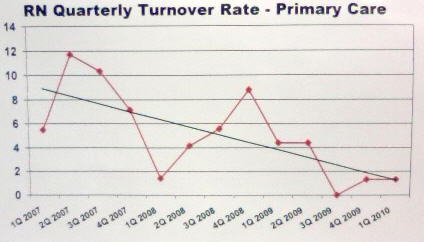
If you draw the same data as a control chart, the process was out of control early, but has returned to statistical process control. We would need three more points to have 8 points in a row below the center line (a process shift).
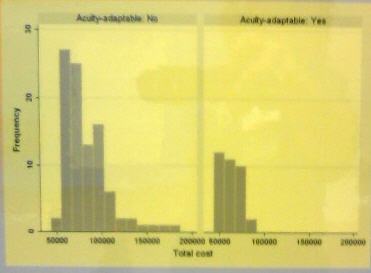
Here’s one pair of charts that told a clear before and after story:
I apologize if it seems like I’m picking on any particular poster. Improvement posters across all three conferences show the misuse of bar charts for time series data, trend lines that may not tell the whole truth and a complete lack of control charts, pareto charts and fishbone diagrams.
Isn’t it time to step up to using control charts, pareto charts and fishbone diagrams to tell an improvement story that’s clear and straightforward? The QI Macros make it easy.

