Home »
Blog » SPC
Improvement Insights Blog
Posts tagged "SPC"
After a hundred years, people still aren’t using control charts. Here’s why:
Download my free eBook, Agile Process Innovation-Hacking Lean Six Sigma for Results.
“Well hi, I’m Jay Arthur, author of “Lean Six Sigma Demystified” and QI Macros [software].
“Control charts just turned a hundred years old, but if you look at the adoption rate for control charts it’s been pretty flat. You see it mainly in manufacturing, you don’t see it much in healthcare.
“We attend two big healthcare quality conferences: At the Magnet conference, out of hundreds of posters, 89% use line and bar charts (which I consider to be last-century technology).
Continue Reading "Why Aren’t People Using Control Charts? A Root Cause Analysis"
Posted by Jay Arthur in Improvement Insights.
Control charts have been around for 100 years. Why isn’t everyone using them?
“I’m Jay Arthur, author of “Lean Six Sigma Demystified” and QI Macros [software].
“I was at the American Society for Quality World Conference on Quality and Improvement and some guy came up to me and started wanting to argue with me about how you can’t use control charts for non-normal data. He was ranting about that… and by the way, Donald Wheeler has already answered that question: Yes you can; shut up. All right?
“But, you know, control charts have been around for 100 years.
Continue Reading "Control Charts are 100 years old"
Posted by Jay Arthur in Improvement Insights.
A statistician using a bar chart is like a surgeon using a butter knife. Here’s why:
Download my free ebook Agile Process Innovation.
“Hi, I’m Jay Arthur, author of “Lean Six Sigma Demystified” and QI Macros [software].
“I was recently perusing the American Statistical Association’s magazine, and they had some posters that were done by kids in K through 12. This one was an analysis of what kind of charts and graphs are used in poster presentations at statistical conferences. They found that more often than not, the winners had bar charts, and that bar charts were very popular because of their simplicity.
Continue Reading "Statisticians Using Bar Charts"
Posted by Jay Arthur in Improvement Insights.
Ever noticed that if you start someone on one path, they tend to stay on it even if it was only a starter path? How do you get people started in quality improvement and SPC?
“Hi, I’m Jay Arthur, author of “Lean Six Sigma Demystified” and QI Macros [software].
“Have you ever noticed that if you start somebody on one path they will stay on that path? If you start people on another path they’ll stay on that path, right? Because it cost them a certain amount of time and energy to learn how to be on that path.
Continue Reading "Start People on the Right Path"
Posted by Jay Arthur in Improvement Insights.
People think you have to know statistics to do Statistical Process Control (SPC). Not true, here’s why.
“I’m Jay Arthur, author of “Lean Six Sigma For Hospitals” and QI Macros [software].
“I’ve noticed that whenever I say the phrase “Statistical Process Control,” people start to freak out. It’s unnecessary because guess what? You don’t need to know statistics to do Statistical Process Control.
“Shewhart was a statistician, he figured out how to calculate the variances and… how to calculate the upper and lower control limits and what that all means. Then Nelson expanded all of that stuff, so the statisticians did the statistical part.
Continue Reading "You Don’t Need to Know Statistics to Do Statistical Process Control"
Posted by Jay Arthur in Improvement Insights, QI Macros.
Most people are terrified of “statistical” anything. Do you think SPC is too complex? You may not like the alternative.
“Whenever I talk to people about Statistical Process Control, first the word “statistical” scares the living crap out of them. But they say, “Well, you know, uh… I’m not that good with math and formulas,” and I say, “Well, you don’t have to know math and formulas. We’ve got software that’ll do all that for you. What you have to do is know what the chart tells you about what you should do about your process. They’re all a little surprised.
Continue Reading "Think SPC is Too Complex?"
Posted by Jay Arthur in Improvement Insights, Lean, Six Sigma, Statistics.
Mom used to sew all of her own clothes, just like many people in Six Sigma are creating their own chart templates or code. Mom figured out a better way. You can too.
“Growing up in the 50s, my mom made all of her own clothes. She would go to the fabric store and pick out fabrics and pick out patterns. She’d come home and on this big cardboard thing she’d lay out the pattern on the thing and cut out all the pieces. Then she’d have bought thread, and then she’d sit there at the sewing machine and she would sew blouses and skirts and dresses.
Continue Reading "Are You Sewing Your Own Six Sigma Toolkit?"
Posted by Jay Arthur in Improvement Insights, Lean, Six Sigma.
There’s a lot of hype about Big Data, but approximately three-quarters of the money spent had no return on investment. There’s big profits in small data. Here’s what to do differently.
“Hi, this is Jay Arthur, author of “Lean Six Sigma Demystified” and the QI Macros [software].
“Big Data is actually bad for small business. Now, there was a lot of hype around Big Data, but it kind of crested about 2011-2012 and it’s falling down now because people are discovering that Big Data doesn’t always give you the answers you want. What you need [is] small data, and there’s big profits in small data.
Continue Reading "Why Big Data is Bad for Small Business"
Posted by Jay Arthur in Data Mining, Improvement Insights.
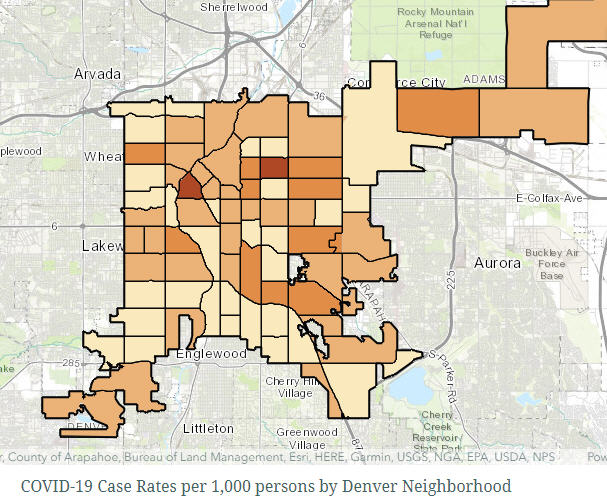
There are COVID-19 hot spots and cold spots. How do we keep the cold spots open and detect and quarantine warming spots? Maybe statistical process control can help.
“Hi, I’m Jay Arthur, author of “Lean Six Sigma for Hospitals” and QI Macros [software].
“Back in the mid 1800s there was a cholera outbreak in London, and John Snow (not of Game of Thrones, but Dr. John Snow) said, “I think there’s a pattern here.” He went out and figured out that everybody who had cholera was getting water from the Broad Street pump. Back then, there was no indoor running water so you had to take your pail, go out to the pump and get your water for your home or your business or your restaurant.
Continue Reading "Cholera and COVID-19 Hot Spot Detection and Quarantine"
Posted by Jay Arthur in Improvement Insights, Six Sigma.