Are You Wasting Time in Six Sigma?
Are you wasting time in Six Sigma on unnecessary steps?
Here’s how to kick start your improvement efforts.
Are you wasting time in Six Sigma on unnecessary steps?
Here’s how to kick start your improvement efforts.
If you’re not getting the results you want from Six Sigma, there might be a problem in the development of your projects.
Here are some of the mistakes I see in Six Sigma projects.
I believe we are teaching people things they don’t need to know to solve problems they don’t have to impress people they don’t like.
You don’t have to know everything about statistics to do Six Sigma projects. What you need to know adheres to the 4/50 Rule: 4% of the knowledge will deliver over 50% of the results.
And if you automate the formulas and decision trees using QI Macros, you can collapse the learning curve in such a way that “No Belts” can go from zero to hero in a matter of hours. Here’s how:
Remember how you learned things when you were a kid? That’s not how anyone teaches Lean Six Sigma, but it could be.
Continue Reading "Show-Do-Know – The Secret to Accelerated Learning"
One of our QI Macros users sent me a Greenbelt Project to review. The team did a great job of using the tools and connecting the dots. There was only one small problem…
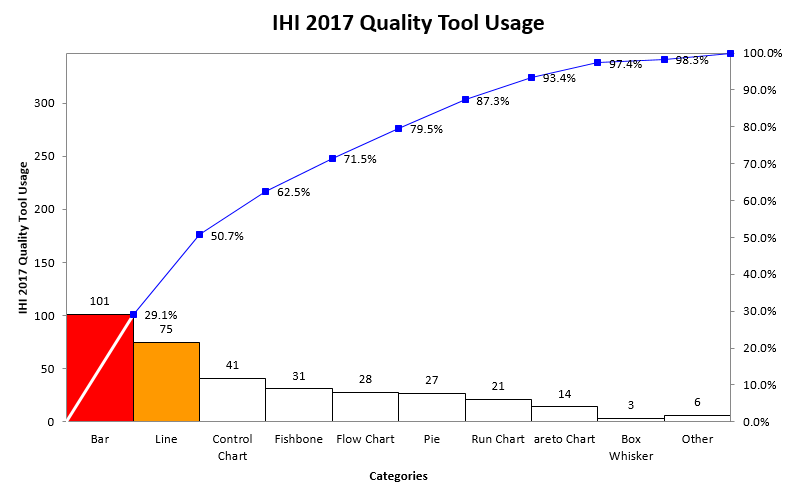
Most of the improvement posters at this year’s Institute for Healthcare Improvement (IHI) conference are still using line, bar and pie charts, not the tools of quality improvement. There were several posters using QI Macros control charts, Pareto charts and fishbones this year from Sutter Health and Howard University Hospital.
Everyone seems to think that top down, leadership-driven is the only way to implement Lean Six Sigma. It’s not.
50 years of research proves that it fails half the time. Yep, 50% failure rate. That’s less than 1 sigma.
This type of failure is so common that it even has a name: The Stalinist Paradox.
The recent collapse of GE stock price has led to a lot of discussion. Here’s my two cents.
Jack Welch implemented Six Sigma at GE which drove many CEOs to do the same. From scuttlebutt I’ve picked up over the years, this lead to crazy rules like every employee had to do two Six Sigma projects a year. This would violate Pareto’s Rule: if only 20% of the business is creating 80% of the defects, waste and rework, having employees try to fix the remaining 80% of the business is a waste of resources. Six Sigma needs focus, not spread.
Jeffery Immelt reduced leadership support for Six Sigma.
“Our evolutionary instincts sometimes lead us to see patterns when there are none there. People have been doing this all the time – finding patterns in random noise.” – Tomaso Poggio
People just need a way to separate the Signal from the Noise.
Here are some insights from the book by Nate Silver.
This recent article talks about how GE measured Six Sigma success:
“Engineers and scientists were measured on how many Six Sigma projects they completed during the year.”
Since I know that 4% of the business is causing over half of the waste, rework and lost profit (the 4-50 rule), making everyone do “Six Sigma projects” is a form of overproduction (violating a Lean rule). It creates waste, rework and unhappy employees. It makes people put trivial improvements in Six Sigma format to achieve the goals.
Measure Six Sigma success by bottom-line, profit and productivity enhancing results, not projects. Use data to focus improvements to maximize results and minimize effort.

KnowWare International, Inc.
2696 S. Colorado Blvd., Ste. 555
Denver, CO 80222 USA
Toll-Free: 1-888-468-1537
Local: (303) 756-9144
