Home »
Blog » QI Macros » Page 31
Improvement Insights Blog
Posts tagged "QI Macros"
You don’t practice medicine the way they did 100 years ago.
Why are you implementing Quality Improvement strategies from 100 years ago?
21st Century Quality Improvement needs to be accelerated; fast, responsive and effective. QI Macros for Excel is the easiest to learn, the easiest to use, and the most affordable SPC software to implement across your entire organization.
Watch this short video to see how easy it is to accelerate your Quality Improvement:
Download a FREE 30 day trial at the link below and see for yourself how easy it is to use this powerful, affordable Quality Improvement tool:
https://www.qimacros.com/trial/30-day/
Continue Reading "QI Macros for Healthcare"
Posted by Jay Arthur in Healthcare, QI Macros.
This was a webinar Jay presented to ASQ Chicago on 8/12/20: “Agile Lean Six Sigma – Hacking Lean Six Sigma for Results.”
(In addition to the recorded webinar, there is a bonus featuring more on a topic Jay was discussing during the warmup and technical troubleshooting period just prior to the start of the webinar. Enjoy!)
Continue Reading "ASQ Chicago webinar, 8/12/20"
Posted by Jay Arthur in Data Mining, Manufacturing, QI Macros, Webinar.
Over 80 people signed up for this webinar, with Jay Arthur demonstrating how to use some of the useful features of QI Macros, as well as some of the new features introduced in recent releases of the software.
Some attendees were familiar with the software and already use it, some had only begun to use it; all were interested in learning new ways that QI Macros can help them with their Agile Lean Six Sigma and Quality Improvement efforts. (You can hear him answering questions and comments typed in by webinar attendees.)
If you saw a feature demonstrated in the webinar that might have been added to QI Macros after the version you’re using (for instance, the Templates Wizard, the Fixed Limit indicator or the automated Process Change Wizard), you may need to purchase an upgrade to bring your QI Macros to the current version.
Continue Reading "8/11/20 QI Macros Webinar"
Posted by Jay Arthur in Data Mining, Excel, QI Macros, Webinar.
Yankee Spirit (50% reduction in delay, defects and deviation) is easy to achieve. It’s imperative. Here’s why:
“Hi, I’m Jay Arthur, author of “Lean Six Sigma for Hospitals” and QI Macros [software].
“When I first got started in Quality Improvement, our training folks talked about Yankee Spirit as a method of setting a goal. What’s Yankee Spirit? Well, Yankee Spirit is simply a 50% reduction in delay, defects and deviation.
“Well, that just sounds like we’re just taking a dartboard throwing a thing at it, but it was years later that I realized that this is actually scientifically doable. As I started to look at it, Pareto’s rule says 20% of what you do produces 80% of the waste, rework, lost profit, patient harm… whatever you want to call it.
Continue Reading "Yankee Spirit Goal Setting"
Posted by Jay Arthur in Improvement Insights, Six Sigma.
If you’re a registered NAHQ Next 2020 attendee, you can view Jay Arthur’s showcase until October 31, 2020.
1. Click on the link below.
https://www.webcastregister.live/nahq2020/welcome
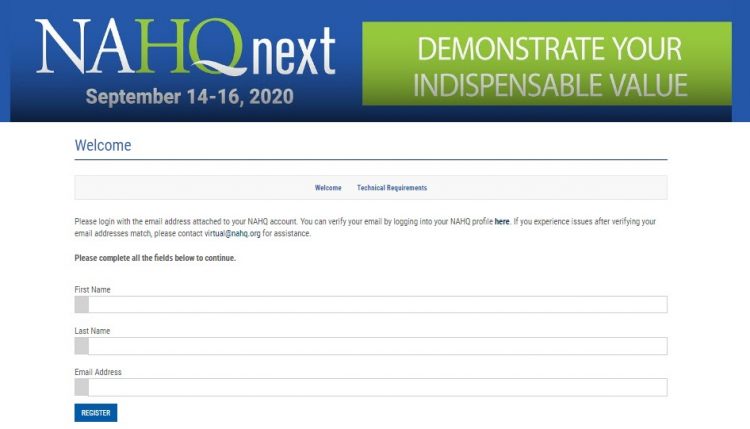
2. Click on the NAHQ Next top banner to log in. It will take you to the page below. Log in with your name and email address:
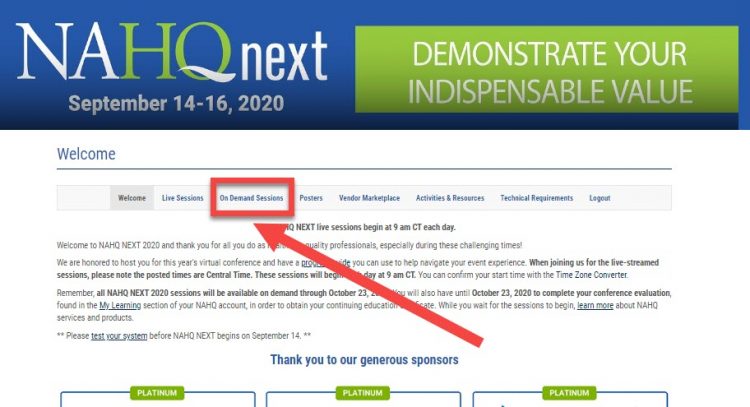
 3. Once you’re logged in, visit the On-Demand Sessions and scroll to the very bottom to view Jay’s session, “Zero Harm and the Trillion Dollar Prescription.”

Continue Reading "NAHQ NEXT 2020 HQ Showcase – Jay Arthur"
Posted by Jay Arthur in Agile Lean Six Sigma, Healthcare, Jay Arthur Blog, QI Macros.
Line charts with trend lines can be misleading. They can provide a kind of “false positive” that implies improvement where there is none. Here’s why:
“Hi, I’m Jay Arthur, author of “Agile Process Innovation.”
“I go to all these trade shows and I see a lot of poster presentations but they’re using line charts and then they draw a trend line through them and then they say, “Oh, we made an improvement.” No you didn’t. If it doesn’t really fit the line very well, if your goodness-of-fit metric is less than 80%, I’m not buying it. But nobody gives me a goodness-of-fit metric called r-squared, they just show me a line graph or a bar chart and then they show a little line through it.
Continue Reading "Trends Are Not Always Improvements"
Posted by Jay Arthur in Improvement Insights.
Breast Cancer is Rare, yet we subject women to mammograms to try to detect it. False positives are 20X higher than true positives. Deming said: “Cease dependence on inspection to achieve quality.”
“Hi, I’m Jay Arthur, author of “Lean Six Sigma Demystified,” “Lean Six Sigma for Hospitals,” and the QI Macros [software].
“I found another interesting item in Malcolm Gladwell’s book; again, it was in the back notes. They were talking about mammograms. Breast cancer itself is really rare, it’s like less than a half of 1% of women who get a mammogram actually have cancer, so it’s like looking for a needle in a haystack.
Continue Reading "Mammograms are a Type of Inspection"
Posted by Jay Arthur in Improvement Insights.
This was a webinar presented for AAHQ members, with Jay Arthur first doing an overview on the IHI’s goal, and then going into more detail and highlighting examples on how implementing Agile Lean Six Sigma can speed an organization’s improvement process and better sustain results.
Continue Reading "7/24/20 AAHQ Trillion Dollar Prescription webinar"
Posted by Jay Arthur in Agile Lean Six Sigma, Healthcare, Webinar.
If you look at improvement project posters at quality conferences around the country, you’ll find that almost everyone is using Excel line and bar charts. Even after decades of Six Sigma training and association membership. What’s the hold up? Here’s my take:
“Hi, I’m Jay Arthur, author of “Lean Six Sigma Demystified” and QI Macros [software].
“Every year I look at lots of improvement posters and I keep wondering, “Why isn’t anyone using the tools of Quality?” Control charts, Pareto charts, histograms… Most of them are just using plain old Excel line and bar charts. Now it might be because they don’t know about the power and beauty and how easy it can be now to do Control charts, Pareto charts and fishbones.
Continue Reading "Why Are People Using Line and Bar Charts, not Control Charts?"
Posted by Jay Arthur in Improvement Insights, Lean, Six Sigma.
Predators are lazy. So are humans. Here’s why that’s a problem:
“I was out in Hawaii and I saw these people doing shore fishing. I thought, “That might look fun.” I went to this one store that sells sporting goods stuff and I said, “Is there anybody who has a class or anything on shore fishing?” He said, “No, no; nobody does that,” he said. “But all you have to understand is that predators are lazy.”
“I think I’ve talked about this before, but essentially, the predatory fish come in on the tide and then they go out on the tide.
Continue Reading "Predators are Lazy"
Posted by Jay Arthur in Improvement Insights.

 3. Once you’re logged in, visit the On-Demand Sessions and

