Home »
Blog » Cp Cpk
Improvement Insights Blog
Posts tagged "Cp Cpk"
Struggling to get a good Cp and Cpk? It might be your data. Here’s why:
“I’m Jay Arthur, author of “Lean Six Sigma Demystified” and QI Macros [software].
“We had a guy call in the other day and he was trying to determine the capability of his process. Unfortunately, he’d taken [measurements of] everything from his startup to his shutdown scrap and ran that as a capability study, and he wasn’t capable. I said, “Well, there you go…” But if you run a control chart of that, you can see the wiggly startup and the wiggly shutdown and then there’s this nice stable process in the middle.
Continue Reading "Capability Analysis Issues"
Posted by Jay Arthur in Improvement Insights.
I found a discussion on MyASQ’s Website about Cpk formulas. Why is anyone talking about how to calculate formulas by hand? It’s a waste of time. Here’s why:
“Hi, I’m Jay Arthur, author of “Lean Six Sigma Demystified” and QI Macros [software].
“This morning I was out on the myASQ website, and there was a question about Cp and Cpk and Ppk formulas and stuff like that. And there was, you know, “Well, standard deviation” and “Why do we have to do R Bar over D2?” or whatever it was, you know. The answers were like, “Well, you know, standard deviation is pretty close to whatever…”
“I was [thinking], “What is the question here?
Continue Reading "Why Are We Still Talking about Cp/Cpk and Pp/Ppk Formulas?"
Posted by Jay Arthur in Improvement Insights, Jay Arthur Blog, QI Macros, Six Sigma, Statistics.
A QI Macros customer called to ask how he could figure out the specification limits to give him a Cp/Cpk of 1.33. What’s wrong with this question? The answer is obvious isn’t it?
Continue Reading "Who Sets Your Specification Limits?"
Posted by Jay Arthur in Improvement Insights, QI Macros, Six Sigma.
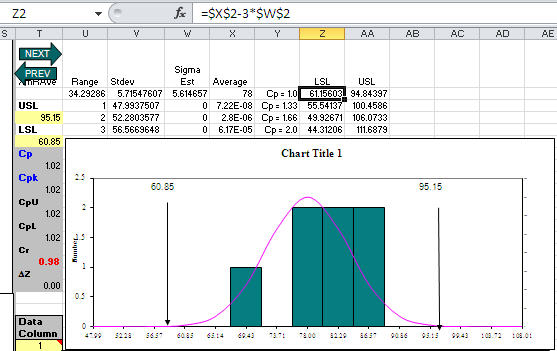
Customer asked me what seemed like a strange question: What specification limits do I need to get a Cp greater than one? Usually her customer should set specification limits, but her boss wanted to know what they could deliver. Hmmmm!
Then I realized that since QI Macros templates (e.g., XmR chart) calculate the average and sigma estimator, the LSL/USL for Cp = 1.0 would be:
LSL = Average – 3*SigEst USL = Average+ 3*SigEst
For Cp = 1.33, just change the 3 to a 4; Cp = 1.66, change the 3 to a 5. Here’s an XmR chart template with some sample data and calculations to reverse engineer spec limits:
Continue Reading "What USL/LSL Do I Need for Cp>1?"
Posted by Jay Arthur in QI Macros, Six Sigma, Statistics.

