Home »
Blog » Six Sigma » Page 18
Improvement Insights Blog
Latest "Six Sigma" Posts
I’ve lived through Business Process Reengineering which often stumbled because it was impossible to take a complex system and “reengineer” it. The only method I’ve found that works consistently is Agile Process Innovation. Here’s how it works:
Join my Agile Quality Improvement Movement. Sign up to receive Weekly Agile Six Sigma emails right in your inbox! Click HERE to subscribe.
Continue Reading "Agile Process Innovation"
Posted by Jay Arthur in Improvement Insights, Lean, QI Macros, Six Sigma.
People often ask me, how big should an improvement team be? My answer: as small as possible.
In Fred Brooks’ Mythical Man Month, he points out that communication pathways increase in a nonlinear fashion. The formula is simple:
(n2-n)/2
Where n is the number of people on a team.
- 2 people = 1 connection (4-2)/2
- 3 people = 3 connections (9-3)/2
- 4 people = 6 connections (16-4)/2
- 5 people = 10 connections (25-5)/2
- 6 people = 15 connections (36-6)/2
- 7 people = 21 connections (49-7)/2
The bigger the team, the more time is spent on discussion and communication, not progress.
Continue Reading "Team Communication Costs"
Posted by Jay Arthur in Jay Arthur Blog, Lean, Six Sigma.
DMAIC is similar to software’s Waterfall methodology that has been replaced by Agile.
We can do the same thing with DMAIC. Here’s how.
Join my Agile Quality Improvement Movement. Sign up to receive Weekly Agile Six Sigma emails right in your inbox! Click HERE to subscribe.
Continue Reading "DMAIC from Waterfall to Agile"
Posted by Jay Arthur in Agile Lean Six Sigma, Improvement Insights, Lean, QI Macros, Six Sigma.
Most movies follow a standard arc of discovery and transformation.
The Quality Hero’s Journey follows a similar arc. Here’s how:
Just for fun, watch Kurt Vonnegut’s presentation of the Hero’s Journey.
Join my Agile Quality Improvement Movement. Sign up to receive Weekly Agile Six Sigma emails right in your inbox! Click HERE to subscribe.
Continue Reading "The Quality Hero’s Journey"
Posted by Jay Arthur in Improvement Insights, QI Macros, Six Sigma.
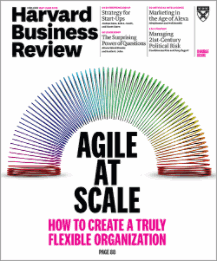
The cover of the May-June 2018 issue of Harvard Business Review highlights “Agile” as the future of business. This is the way business is going to stay competitive in the future. Speed is the killer app!
Lean Six Sigma can no longer cling to its old-fashioned way of doing things: weeks of training, months for improvement teams. Here’s why:
Join my Agile Quality Improvement Movement. Sign up to receive Weekly Agile Six Sigma emails right in your inbox! Click HERE to subscribe.
Continue Reading "Agile Lean Six Sigma"
Posted by Jay Arthur in Agile Lean Six Sigma, Improvement Insights, Lean, QI Macros, Six Sigma.
Are you making one of the most common mistakes in Six Sigma? Are you forgetting the control phase?
If you do forget to implement a control plan and control charts to monitor and corrective actions, you might just as well have not wasted everyone’s time.
Join my Agile Quality Improvement Movement. Sign up to receive Weekly Agile Six Sigma emails right in your inbox! Click HERE to subscribe.
Continue Reading "Forgetting The Control Phase?"
Posted by Jay Arthur in Improvement Insights, Jay Arthur Blog, QI Macros, Six Sigma.
Do you know people who only dabble in Lean Six Sigma? They get in, get certified and get out?
You can use the tools of quality everywhere in your life and work for the rest of your life.
Why stop?
Join my Agile Quality Improvement Movement
Continue Reading "Going In and Out of Lean Six Sigma?"
Posted by Jay Arthur in Improvement Insights, Lean, QI Macros, Six Sigma.
Are we in the quality community letting our past dictate our future? Is our bias stopping us from seeing the possibilities?
Join the Agile Quality Improvement Movement
Continue Reading "Confirmation Bias In Lean Six Sigma Implementation"
Posted by Jay Arthur in Improvement Insights, Lean, QI Macros, Six Sigma.
At ASQ World, Craig Plain gave a fun presentation on Cartoons for Quality.
One of the exercises used a standard work procedure for drawing a pig. Try it yourself
Standard Work Procedure Pig Cartoon Instructions
Here’s mine:
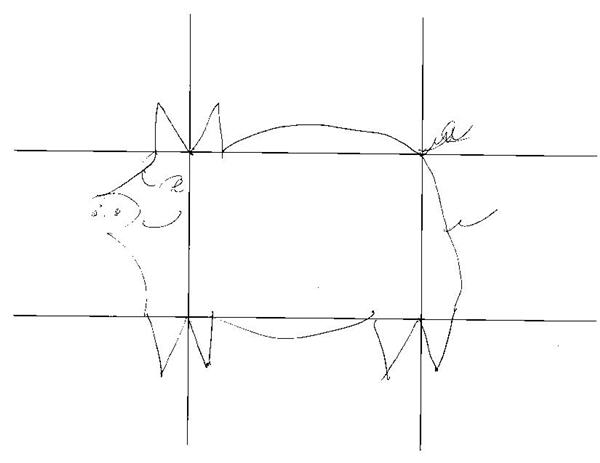
While I’m not normally fond of using games for training, I thought it was interesting how none of us drew exactly the same pig.
Continue Reading "Pig Cartoon – Standard Work"
Posted by Jay Arthur in Lean, Six Sigma.

