Kaizen Muda Gemba
Are Japanese words slowing your Lean Six Sigma implementation?
Learn the power of Agile Lean Six Sigma: https://www.qimacros.com/pdf/Agile-Process-Innovation.pdf
Are Japanese words slowing your Lean Six Sigma implementation?
Learn the power of Agile Lean Six Sigma: https://www.qimacros.com/pdf/Agile-Process-Innovation.pdf
Still practicing last century quality improvement? The economy has changed. Current trends demand an Agile approach to Six Sigma. Isn’t it time to embrace 21st Century Quality?
Learn Agile Process Innovation – 21st Century Quality Improvement
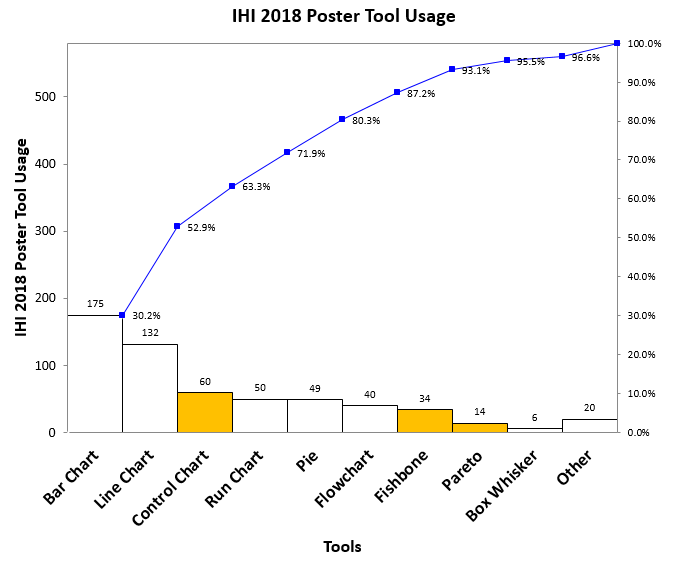
QI Macros exhibited at the Institute for Healthcare Improvement (IHI) conference in Orlando this week. There were over 500 improvement posters. Like prior years, I used a checksheet to collect data about the tools used. Once again, the results are disappointing. Quality tools–control charts, Pareto charts, and Fishbone diagrams–are still a small percentage of tools used, unchanged since I started collecting data in 2015. Bar and line charts still dominate posters; I call them Dumb and Dumber charts.
The quest for Zero Harm using high-reliability methods and tools (i.e., Lean Six Sigma, control charts, Pareto charts, histograms, etc.) is gaining momentum.
Continue Reading "IHI Quality Tool Usage in Poster Presentations"
Too many quality professionals are clinging to the way things have always been done. There’s some sort of taboo about doing things quickly and easily. What are the differences between 20th and 21st Century Quality? Watch and find out:
20th Century Quality needed big Six Sigma implementations because you had to learn things that aren’t necessary any more. Take a 21st Century, Agile approach to Six Sigma to start getting results immediately.
A QI Macros customer called to ask how he could figure out the specification limits to give him a Cp/Cpk of 1.33. What’s wrong with this question? The answer is obvious isn’t it?
Is the foggy complexity of Lean Six Sigma preventing widespread adoption? I think it is:
Learn more about Dan Roam’s Blah Blahmeter here: https://www.youtube.com/watch?v=U6kmObnh2jo
Does Your Root Cause Analysis Fail The Last Why Because It Presupposes A Solution?
The Nov-Dec 2018 HBR reports that Lean, Six Sigma and Agile “always work well initially, but often the gains fade quickly.”
What’s needed to sustain improvements?
Start monitoring your improvement projects using QI Macros control charts.
Download a free trial at https://www.qimacros.com.

KnowWare International, Inc.
2696 S. Colorado Blvd., Ste. 555
Denver, CO 80222 USA
Toll-Free: 1-888-468-1537
Local: (303) 756-9144
