Home »
Blog » QI Macros » Page 13
Improvement Insights Blog
Latest "QI Macros" Posts
You don’t practice medicine the way they did 100 years ago.
Why are you implementing Quality Improvement strategies from 100 years ago?
21st Century Quality Improvement needs to be accelerated; fast, responsive and effective. QI Macros for Excel is the easiest to learn, the easiest to use, and the most affordable SPC software to implement across your entire organization.
Watch this short video to see how easy it is to accelerate your Quality Improvement:
Download a FREE 30 day trial at the link below and see for yourself how easy it is to use this powerful, affordable Quality Improvement tool:
https://www.qimacros.com/trial/30-day/
Continue Reading "QI Macros for Healthcare"
Posted by Jay Arthur in Healthcare, QI Macros.
This was a webinar Jay presented to ASQ Chicago on 8/12/20: “Agile Lean Six Sigma – Hacking Lean Six Sigma for Results.”
(In addition to the recorded webinar, there is a bonus featuring more on a topic Jay was discussing during the warmup and technical troubleshooting period just prior to the start of the webinar. Enjoy!)
Continue Reading "ASQ Chicago webinar, 8/12/20"
Posted by Jay Arthur in Data Mining, Manufacturing, QI Macros, Webinar.
Over 80 people signed up for this webinar, with Jay Arthur demonstrating how to use some of the useful features of QI Macros, as well as some of the new features introduced in recent releases of the software.
Some attendees were familiar with the software and already use it, some had only begun to use it; all were interested in learning new ways that QI Macros can help them with their Agile Lean Six Sigma and Quality Improvement efforts. (You can hear him answering questions and comments typed in by webinar attendees.)
If you saw a feature demonstrated in the webinar that might have been added to QI Macros after the version you’re using (for instance, the Templates Wizard, the Fixed Limit indicator or the automated Process Change Wizard), you may need to purchase an upgrade to bring your QI Macros to the current version.
Continue Reading "8/11/20 QI Macros Webinar"
Posted by Jay Arthur in Data Mining, Excel, QI Macros, Webinar.
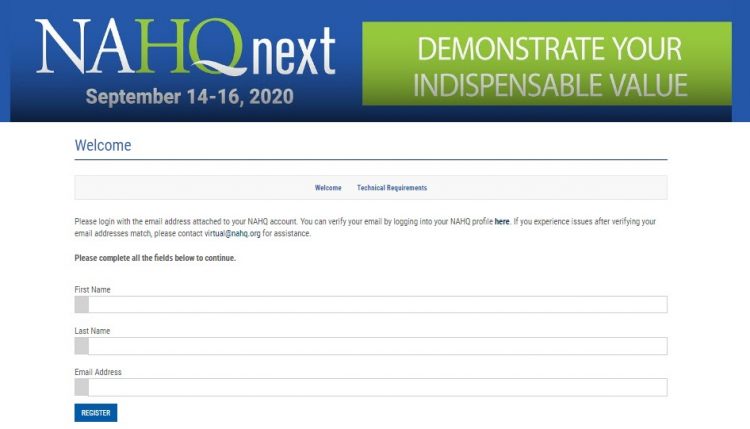
If you’re a registered NAHQ Next 2020 attendee, you can view Jay Arthur’s showcase until October 31, 2020.
1. Click on the link below.
https://www.webcastregister.live/nahq2020/welcome
2. Click on the NAHQ Next top banner to log in. It will take you to the page below. Log in with your name and email address:
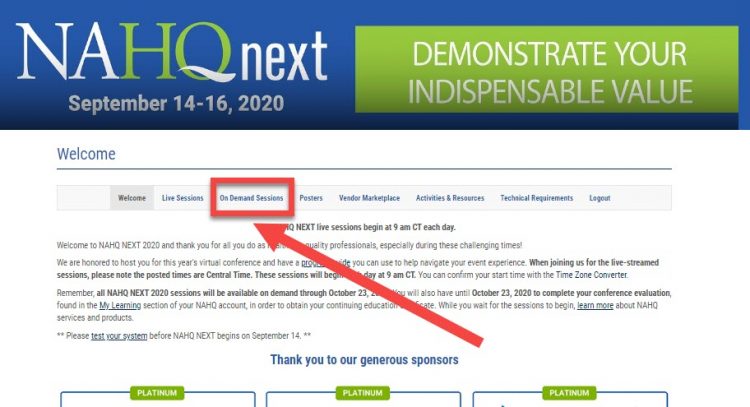
 3. Once you’re logged in, visit the On-Demand Sessions and scroll to the very bottom to view Jay’s session, “Zero Harm and the Trillion Dollar Prescription.”
Continue Reading "NAHQ NEXT 2020 HQ Showcase – Jay Arthur"
Posted by Jay Arthur in Agile Lean Six Sigma, Healthcare, Jay Arthur Blog, QI Macros.
Over 80 people signed up for this webinar, with Jay Arthur demonstrating how to use some of the useful features of QI Macros, as well as some of the new features introduced in recent releases of the software.
Some attendees were familiar with the software and already use it, some had only begun to use it; all were interested in learning new ways that QI Macros can help them with their Agile Lean Six Sigma and Quality Improvement efforts. (You can hear him answering questions and comments typed in by webinar attendees.)
If you saw a feature demonstrated in the webinar that might have been added to QI Macros after the version you’re using (for instance, the Templates Wizard, the Fixed Limit indicator or the automated Process Change Wizard), you may need to purchase an upgrade to bring your QI Macros to the current version.
Continue Reading "7/7/20 QI Macros Webinar"
Posted by Jay Arthur in Data Mining, Excel, QI Macros, Webinar.
The New York Times published a list of cases by facility. I tweaked it to get Pareto Charts of the biggest problems. Nursing homes and rehab facilities were 64% of the total, then prisons and food processing (e.g., beef, pork, poultry, etc.).
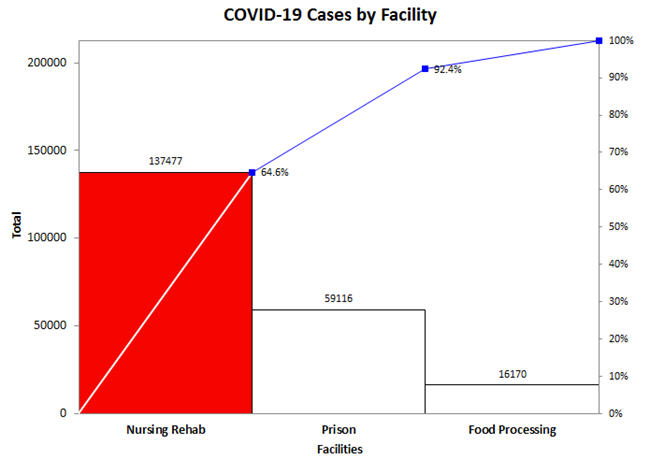
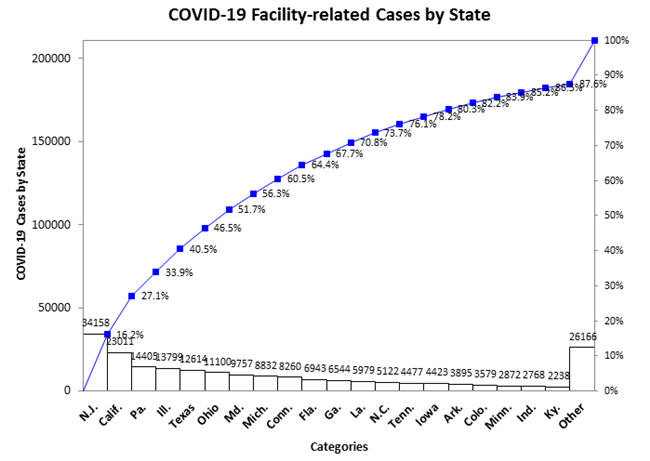
Continue Reading "COVID-19 Cases by Type of Facility"
Posted by Jay Arthur in Agile Lean Six Sigma, Jay Arthur Blog, QI Macros.
Traditional Lean Six Sigma Training takes weeks when it’s possible to train people and get results in one day. Here’s why it costs so much to train people using last century strategies:
“I want to talk to you about the economics of a Six Sigma class. All right, so as much as I hate pie charts, I’m going to use one to demonstrate this. Let’s say you have a classroom and let’s say you have 20 odd people or something go in there. Now, I can tell you in advance every class is filled with three types of people: Prisoners, Vacationers and Learners.
Continue Reading "The Cost of Lean Six Sigma Training"
Posted by Jay Arthur in Agile Lean Six Sigma, Improvement Insights, Lean, QI Macros, Six Sigma.
Are you skipping Six Sigma stones across the surface of your business or are you finding people who take to it like a duck to water. People who can dive beneath the surface to find the invisible low-hanging fruit?
“Have you ever skipped a rock across a lake? Maybe the first time you threw it out there it just went “sploosh.” Then you figured out that flatter rocks skip better, so you started throwing them out and they’d go “skip-skip-sploosh,” or maybe get three or four or five “skip-skips” and “sploosh.”
“Then a duck came flying in, put out its landing gear and just kind of eased into the water.
Continue Reading "Skipping Stones or Diving Beneath the Surface of Your Business?"
Posted by Jay Arthur in Agile Lean Six Sigma, Improvement Insights, Lean, QI Macros, Six Sigma.
Over 140 people signed up for this webinar, with Jay Arthur demonstrating how to use some of the useful features of QI Macros, as well as some of the new features introduced in recent releases of the software.
Some attendees were familiar with the software and already use it, some had only begun to use it; all were interested in learning new ways that QI Macros can help them with their Agile Lean Six Sigma and Quality Improvement efforts. (You can hear him answering questions and comments typed in by webinar attendees.)
If you saw a feature demonstrated in the webinar that might have been added to QI Macros after the version you’re using (for instance, the Templates Wizard, the Fixed Limit indicator or the automated Process Change Wizard), you may need to purchase an upgrade to bring your QI Macros to the current version.
Continue Reading "6/9/20 QI Macros Webinar"
Posted by Jay Arthur in Data Mining, Excel, QI Macros, Webinar.
That's root cause analysis: What are the common patterns? Where's the Pareto principle?
Continue Reading "Root Cause Analysis in the Time of COVID-19"
Posted by Jay Arthur in Healthcare, Improvement Insights, QI Macros.

