Where Do I Start?
What to Measure for Lean Six Sigma
Inspite of all the training they receive, many Green Belts, Black Belts and No Belts still seem to be confused about what to measure and how to put those measurements into a spreadsheet that can be turned into a control chart, histogram or other chart.. Although I've tackled this issue in other ezines, I'm going to approach it from another view point.
Delay, Defects and Deviation
Remember, in Lean Six Sigma, we're focused on reducing or eliminating unnecessary and preventable delays, defects and deviation.
Defects are Easy
If a product or service has a defect, it's easy to count the number of defects. If you know the number of meals rejected by a customer and the total meals served, or number of prescription errors and total prescriptions, it's easy to collect that information on a spreadsheet and turn that data into a p chart or u chart.
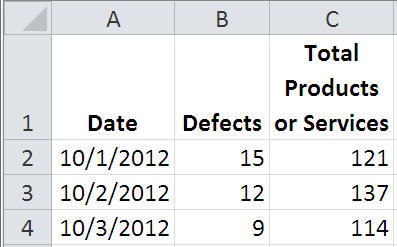
If a single product can have more than one defect (e.g., scratches on a car finish or the same patient can fall more than once) , use the u chart. If the product is either good or bad, pass or fail, use the p chart. If you only have the number of defects without the total, use a c chart. All of these can be easily created from this data using the QI Macros.
Note: If you want to simplify Pareto analysis, use a spreadsheet showing each type of defect:
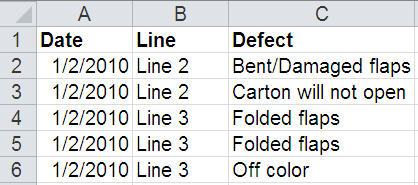
Then use the QI Macros PivotTable Wizard to summarize the data. In this case, we could use a c Chart to monitor Line 1-3 or the Grand Total.
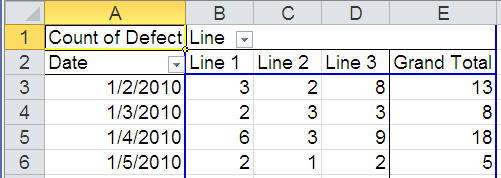
Since we don't have the total number of products produced, we can't use the p or u chart.
Delay Is About Cycle Time or Missed Commitments
Cycle time can be measured in seconds, minutes, hours, days etc. Often, this is measured each time you deliver a product or service. There's no sampling involved. So just create a spreadsheet with the product or service number running down column A and the measurement of cycle time in column B. Use this data and the QI Macros to create an XmR Chart
Another way to look at this data involves customer requirements. For some things, customer's don't care how long it takes you to do it, they just want to know if you can meet your commitment to deliver on time. This leads us back to pass/fail, good/bad analysis, in other words a defect (see above).
FedEx delivers packages overnight. If it takes two days, they've missed a commitment (which they rarely ever do in my experience). FedEx could measure how long it takes before a package is picked up, delivered to a plane, flown to Memphis, sorted, flown to another city or country, and delivered (which I'm sure they do), but the only thing that matters to me, the customer, is that it's delivered the next day. Pass/Fail—that's all I care about.
If your customer only cares about your ability to meet commitments, use the defect spreadsheet and a p chart.
Deviation Is About Measurement
If a product is too big or too small, too fat or too thin, too hot or too cold (e.g., a meal), it could be considered defective (use the defect spreadsheet above). This type of measurent involves pass/fail gages, not micrometers.
In manufacturing, customer requirements are specified in millimeters, inches, weight, density, and so on. These often have a specification tolerance (UCL/LCL +tolerance/2). In this case, we have to measure the product using an appropriate gage. Since manufacturing often produces hundreds if not thousands of parts, sampling may be required to measure enough parts to get a clear picture of how well the production process meets the customer's requirements.
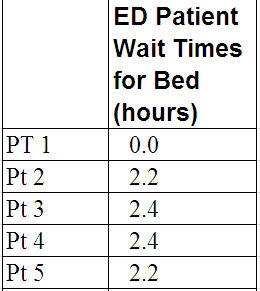
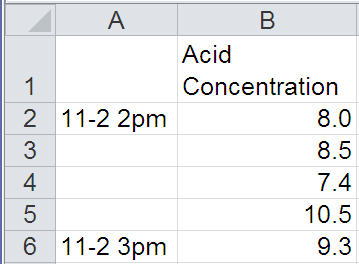
In rare cases, a single measurement will suffice. Put time of measurement (minute, hour, day) in column A and the measurement in column B. Use this data and the QI Macros to create an XmR Chart
In most cases, multiple samples will be required. Put time of measurement (minute, hour, day) in column A of your spreadsheet and the measurements in columns B:F (5 samples are common).
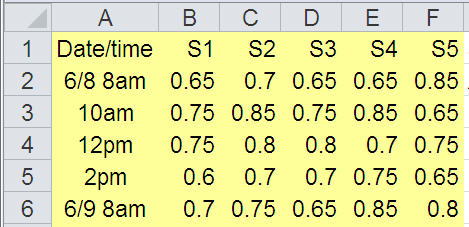
This can be turned into a histogram, XbarR or XbarS chart using the QI Macros.
Here is my point:
If you are trying to use Lean Six Sigma to solve a problem think: delays, defects and deviation.
 Take our FREE Lean Six Sigma Yellow Belt training online.
Take our FREE Lean Six Sigma Yellow Belt training online.
Join 100,000+ Users
in 80 Countries

