Double Your Speed in Half the Time
Lean Six Sigma Lesson 3
In Lesson # 2, we talked about how to double your quality. In this lesson we want to focus on speed. A recent book title argues: “It’s not the big that eat the small, it’s the fast that eat the slow.” Speed is one of your keys to competitive advantage.
The Power Laws of Speed
In the book, Competing Against Time (Free Press 1990), the authors present compelling evidence for the power laws of speed.
The 5% Rule: The actual time required to produce or deliver a service is only 5% of the total elapsed time.
The 25-20 Rule: Every 25% reduction in elapsed time will double productivity and reduce costs 20%.
The 3X2 Rule: Companies that routinely reduce cycle time enjoy growth rates three times the industry average with twice the profit margins.
Problem: Ad Hoc Processes
Most processes, whether it’s ordering, billing, manufacturing, or fulfilling an order, evolve from ad-hoc processes cobbled together over time. To "reduce costs," work is handled in increasingly large batches by specialized individuals. Each employee is busy working hard, but their inbox stays full and their outbox becomes someone else’s inbox.
The Customer’s "Lazy" Order
Whenever I work with a team of people about reducing cycle time, they all moan because they don’t see how they can possibly work any faster…and they’re right. Speed is not about the people working harder or faster; it’s about focusing on the customer’s "lazy" order.
Here’s what I’ve learned: your people are always busy, but the customer’s order is IDLE 90% of the time. The order doesn’t mean to be a bum, but the process forces it to behave this way. Sure, you can always squeeze a little more speed out of the workers on the "factory" line, but the big gains always come from putting the squeeze on the order, not the people.
Computer Operations Example
I worked with one computer operations group who were having trouble finishing their nightly "batch" processing so that they could bring up the customer service online systems in the morning. It was taking, on average, 8-10 hours a night. When we examined the process, we found that the actual time required to run the batch programs was an hour, but there were 32 points in the process where they waited for technician validation before they could move forward. Turns out the computer’s job scheduler could do most of what the techs did, so they automated 30 checkpoints, and the jobs now finish in 1-2 hours…an 80% reduction in cycle time, or a five-fold increase in speed.

Medical Claims Example
Last year, I worked with a medical claims group. It was taking, on average, 140 days or more to process each claim. Upon examination, we found that processing the claim only consumed 7 hours (one day) of this time; the rest of the time the claim sat around waiting for something to happen. In just a two day session we found ways to shave almost 100 days off their cycle time. That’s a 70% reduction in cycle time or a 3-fold increase in speed.
Breaking the Speed Barrier
Want to make breakthrough improvements in your speed? Here’s how:
- Flowchart your process showing all of the activities (boxes), decisions (diamonds), and arrows connecting each box.
Use Post-it® notes to draw your flowcharts on a wall. We found Sticky Notes shaped like arrows on Amazon.. - Starting from the top of your flowchart, from the moment the customer (internal or external) contacts you to place an order for your product or service, make a list of each box, diamond, and arrow…especially the arrows. Tip: 80% of the cycle time is in the arrows, the delays between activities, not in the activities themselves.
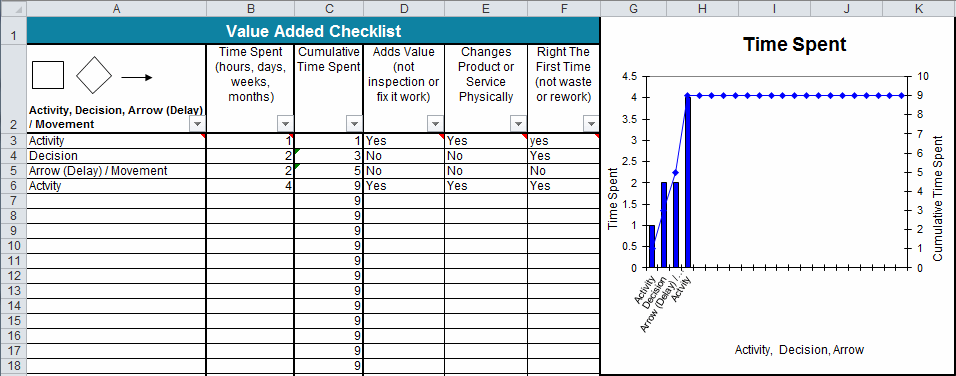
- For each box, diamond, and arrow, estimate the actual time it takes to do that piece of the process. And don’t buy the first answer you get. I asked the claims group how long it takes to receive and get a new claim into the queue. They said 25 days. Not true! It took about 10 minutes to log the form, 24 days before it got to a reviewer, and 45 minutes to validate the form. 55 minutes, not 25 days. For 24 days and 7 hours, the claim was idle waiting for processing.
- Now ask yourself, does this box, diamond, or arrow add value to the order? Value added things change, enhance, or improve the order. What’s not value-added? Delay, idle time, inspection, rework, scrap, and so on.
- Eliminate the delays. In the claims example, there really was no reason for the claim to wait 24 days to be inspected. I recommended that they set a target to log and inspect a claim in less than 24 HOURS. We kept doing this with each major delay in the process to eliminate 100 days total.
- Eliminate the non-value-added work. If a box, diamond, or arrow doesn’t add value, is there a way to reduce its impact or eliminate it from the flow? Why, I wondered, do they have to inspect each incoming claim form? Using problem solving the team could identify the most common error in completing the form and redesign it to reduce or eliminate common errors. Then it wouldn’t need to be inspected or it could be handled easily by a less experienced staff person.
- Establish an action plan to transition from the old, slow process to the newer, faster process. Start the new process using incoming orders and let existing orders drain out of the old process.
- Find a way to "burn the bridges" back to the old process. In one company, they took out the old individual workstations, which forced everyone to participate in learning to use the newer, higher speed ones.
- Establish cycle time measures to sustain the improvement, probably an XmR chart for individual orders.
Templates for flowcharts and value-added analysis are available in the QI Macros Six Sigma Software. For more help, consider the book Lean Simplified.
Avoid the Common Pitfalls
Pitfall #1: Don’t buy the first answer you get. People often include idle time in their answers.
Solution: Keep pushing to determine how long the value-added work really takes. The rest of the time is delay that can be reduced.
Pitfall #2: Old habits are hard to break.
Solution: Burn the bridges to the old process. Implement the new process in such a way that people cannot revert to their old ways of doing things. Want to make your customers happier? More loyal? Less likely to switch suppliers? In today’s high-speed society, they want you to be faster, always faster. Using the simple tools of a flowchart and value-added analysis, I’ve never failed to find 50-70 and even 90% reductions in cycle time. And you can too! It’s a little grueling, pulling apart your process and nit-picking its flow, but you only have to do it once to discover the power in this process.
If you have a team that is lost in flowcharting or you need help conducting a value added analysis session, Jay can provide coaching over the phone or can facilitate one for you. For Lean Six Sigma consulting call 303 756 9144. Haven’t you waited long enough to double your speed by slashing your cycle time?
In Lesson # 4, we’ll look at how to sustain your improvements by using stability and capability analysis.
 Take our FREE Lean Six Sigma Yellow Belt training online.
Take our FREE Lean Six Sigma Yellow Belt training online.
Join 100,000+ Users
in 80 Countries

