Laser Focus
Lean Six Sigma Lesson 1
Avoid Becoming a Lean Six Sigma Casualty
I often hear horror stories from companies that started lots of teams, let them choose their own problems to solve, and waited patiently for the money to start rolling in. Months pass; years pass. Teams become frustrated. "Lean Six Sigma doesn't work!" they cry. Don't let this happen to you!
The first key to Six Sigma success involves laser-focus of every improvement team you start.
A Tale of Two Factories
Every company has two factories:
- The Main Factory that markets, sells, invoices, and delivers your product or service. This factory uses the formula:
Quality + Speed = Profit
- The Fix-it Factory that corrects all of the mistakes in the Main Factory. There's always an "overt" Fix-it factory where you measure defects and delay, and there's a hidden Fix-it factory that corrects things without anyone ever knowing. The Fix-it factory uses the formula:
Delay + Defects + Deviation = Waste, Rework and Lost Profit
In a 3-Sigma company, the Fix-it Factory consumes $25-$40 of every $100 spent, money that could be used to grow a business or improve profits.
Solution: Laser-Focus Using the "Magnificent Seven" Tools
- Use QI Macros PivotTable Wizard to find the invisible low-hanging fruit. Six Sigma gurus often talk about the "low-hanging fruit" in a company, but few know how to find it. I call it invisible low-hanging fruit because the improvement opportunity is hidden in data that looks like this:
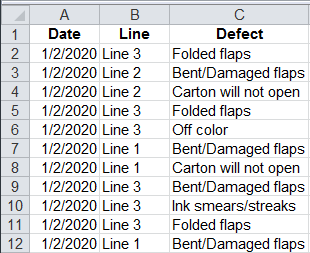
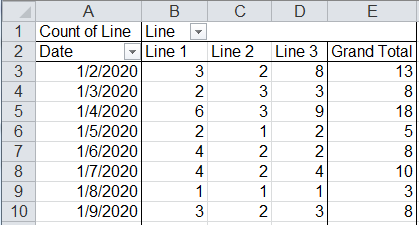
Using the QI Macros PivotTable Wizard, it's easy to summarize this data into something that can be plotted:
- Use the QI Macros to draw a Control Chart showing defects. This answers the questions: "Where are the defects?" In this case Packaging Defects.

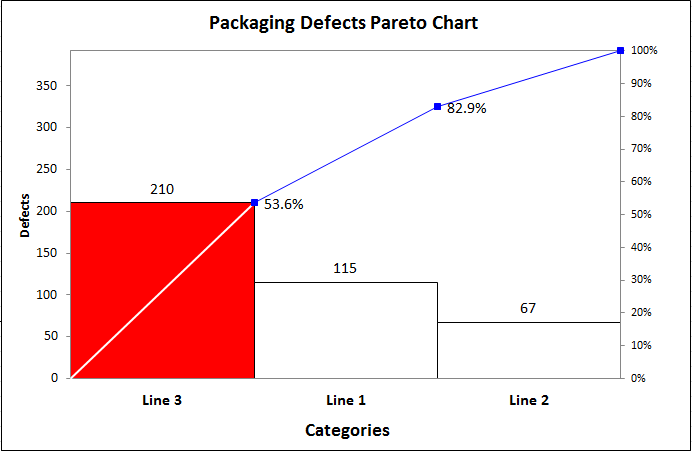
- Pareto chart(s) showing 1, 2, or 3 "big bars" that contribute 50-60% of the problem identified in the control chart. This answers the question"Where's the Mother Lode?" Use the 4-50 Rule: 4% of any business creates over half of the waste and rework. Find it and fix it.
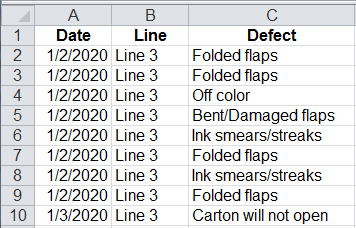
- Drill Down. Line 3 has the most defects, so explore what type of defects happen most often on Line 3. Double click on the Grand Total for Line 3 in the PivotTable to bring up all of the data for Line 3:
Then use the QI Macros to draw a Pareto Chart of types of defects on Line 3:
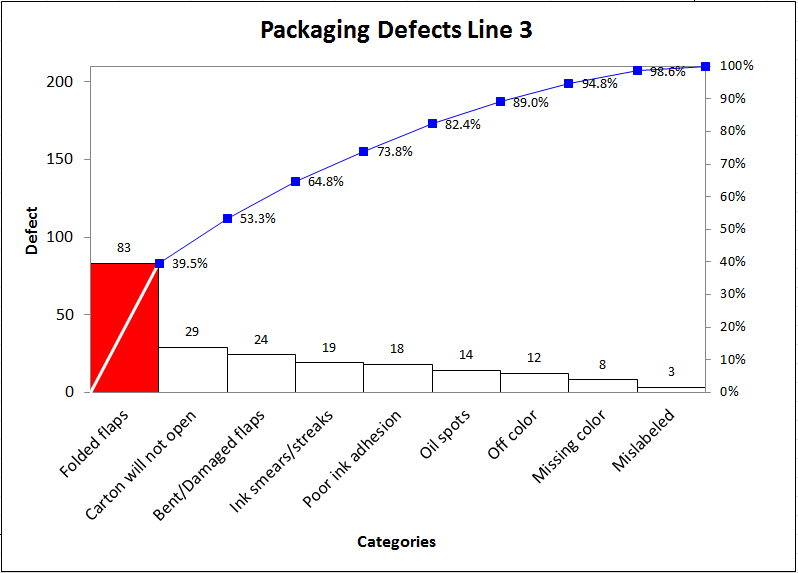
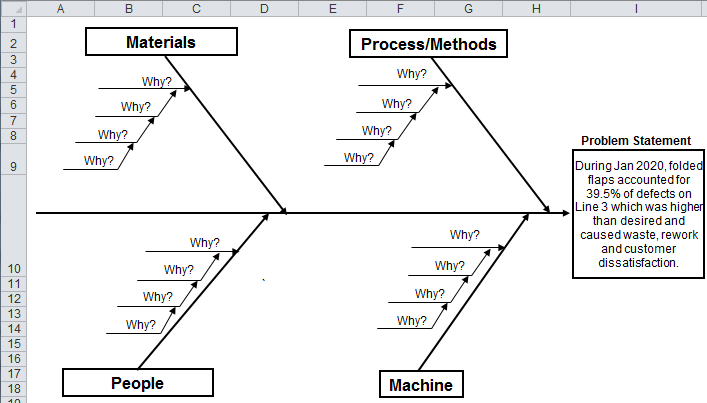
- Write a Good Problem Statement. Use the first big bar on the pareto chart to write your problem statement. A sample problem statement is:During Jan-Feb 2010, Folded Flaps accounted for 39.5% of packaging defects on Line 3 which resulted in waste, rework, lost profit and customer dissatisfaction. Put this in the head of the Ishikawa (Fishbone) diagram:
- Form a Root Cause Analysis team based on this analysis. Too many companies make the mistake of forming a team before analyzing the data; until you know where to focus the effort, you have no idea who should be on the root cause analysis team. These first five steps should take no more than a day or two using existing data. Each of these charts and worksheets are available in the QI Macros Six Sigma Software for Excel. Download a 30 day evaluation copy from the link in the first message of this series.
Don't have the time to do this? It rarely takes more than a day or two to analyze your data and develop improvement stories that identify the 4% of your business causing over 50% of the waste and rework. We can do the data analysis for you. Find out here.
If you have teams that have been meeting for weeks or even months, maybe it's time to start getting results. If you need help getting these teams focused or coming up with actionable improvement projects consider our One Day Lean Six Sigma Workshop.
Telecom Example
One wireless company I worked with had an order error rate of 17% in their service order system. Their target: 9% in 12 months. Only 6 error types out of 200 accounted for 90% of the total errors (4-50 rule). Six different teams met for a half a day on each of the 6 error types. It took 4 months to implement the software changes, and they ELIMINATED 5 of the 6 and cut the last one in half. The order error rate dropped below 3%. Not bad for 10 days of focused root cause analysis. A before and after control chart and pareto chart should look like this.
Set a BHAG
Once you've identified your problem to be solved, set a Big Hairy Audacious Goal (BHAG). Forget about incremental improvements. Go for 50% reductions in cycle time, defects, costs, system downtime and so on. Go for 50% improvements in financial results and customer satisfaction.
I have found that when you go for 10% improvements, you only get incremental ideas. When you go for 50% improvements, you get 50% or bigger ideas, and you often get 70-80% improvements. Breakthroughs!
One CIO set a target for a 50% reduction in computer system downtime; he assigned just one "black belt" and several laser-focused teams that exceeded his BHAG in just six months. BHAGs also force you to narrow your focus to the 4% of the business that will produce the big return on investment.
Avoid the Common Pitfalls
Pitfall #1: Starting a team when you have no data (control chart and pareto chart minimum) indicates you have a problem that can't be solved using Six Sigma. Without data to guide you, you don't know who should be on the team, so you end up with diverse groups of people trying to solve too many different problems. Never start a team that doesn't have a good chance of succeeding. You'll just waste their time and threaten the survival of Lean Six Sigma.Solution: Set the team up for success. 1) Work with data you already have; don't start a team to collect a bunch of new data. 2) Refine the problem before you let a group of people get in a room to analyze root causes. You can guarantee a team's success by laser focusing the problem to be solved. If you want to ensure you have a good problem statement before launching a team, send us your data and we can provide consulting at various levels to get you on your way.
Pitfall #2: Endless Data Gathering. Never start by collecting a bunch of new data. This is just a way of avoiding getting started on real changes. And unless your business is completely ignorant of day-to-day operations and problems, you already have enough data to work with. If a leader working with an improvement expert can't get to this level of specificity, neither can a team!
Solution: Use existing data and just get on with it.
Pitfall #3: Flowcharting the process. I know it sounds sacrilegious, but flowcharting a process at this stage of an improvement effort only serves to make it harder to change later. Once a team spends hours figuring out the current flow, they have essentially drawn a box around their problem solving imaginations. Any and all ideas will be filtered through "the way we do it now."
Solution: Keep team members open to new ideas and possibilities. Start with a problem to be solved not a process to be changed.
In Lesson #2 we will discuss how to Double Your Quality and Slash Your Costs.
 Take our FREE Lean Six Sigma Yellow Belt training online.
Join 100,000+ Users
in 80 Countries

