EWMA Chart
Watch this video to learn how to create a EWMA Chart in Excel using the QI Macros.
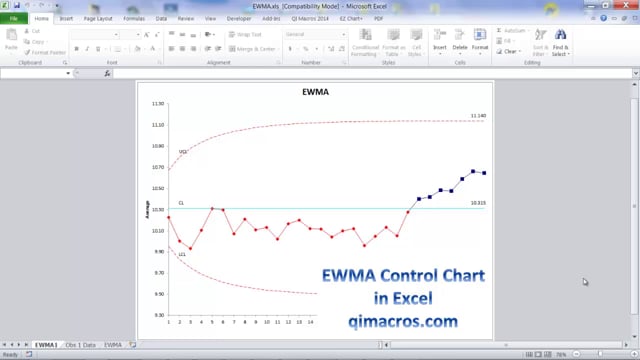
Learn More About EWMA Charts
The EWMA (exponentially weighted moving average) chart can help you evaluate a process when there is only one sample and you are interested in detecting small shifts in performance. The EWMA's performance is similar to the Cusum chart.
Why wait? Start creating these charts and diagrams in seconds using
QI Macros add-in for Excel.
Join 100,000+ Users
in 80 Countries

Why Choose QI Macros ?
Affordable - Just $
379 USD per license
- Less with Quantity Discounts
- No Recurring Annual Fees
- No Charge for Technical Support
Easy to Use
- Adds New Tab to Excel's Menu
- Creates a Chart in Seconds
- PC / Mac: Excel Excel 2021-2024, Office 365
Trusted /
Accurate
- 100,000 Users in 80 Countries
- Save Time vs Writing Formulas
- Our Formulas Are Tested

KnowWare International, Inc.
2696 S. Colorado Blvd., Ste. 555
Denver, CO 80222 USA
Toll-Free: 1-888-468-1537
Local: (303) 756-9144