QI Macros is Powerful because...
it can analyze your data & choose the right chart or statistics test for you.
I purchased QI Macros just to run control charts (worth the price just for that). I had NO idea what a robust product you have developed, and what an amazing bargain I was getting. File me under exceeded customer expectations.
- Scott Campbell
SwedishAmerican Hospital
QI Macros contains these charts, templates and tools.
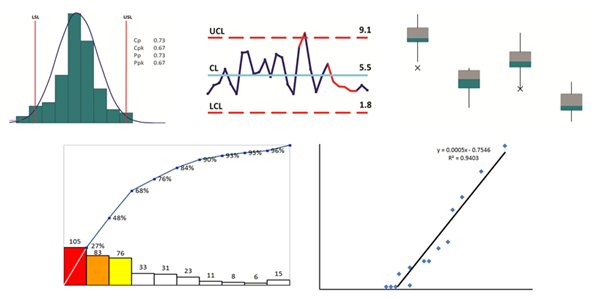
More than 40 charts
- Control charts
- Histograms
- Pareto charts
- Box and Whisker Plots
- Scatter Diagrams
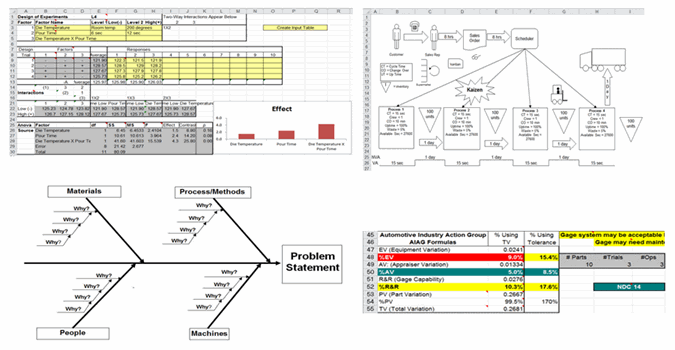
More than 140 fill-in-the blank templates including:
- Fishbone Diagrams
- Value Stream Maps
- Voice of the Customer
- Gage R&R Studies
- DOE
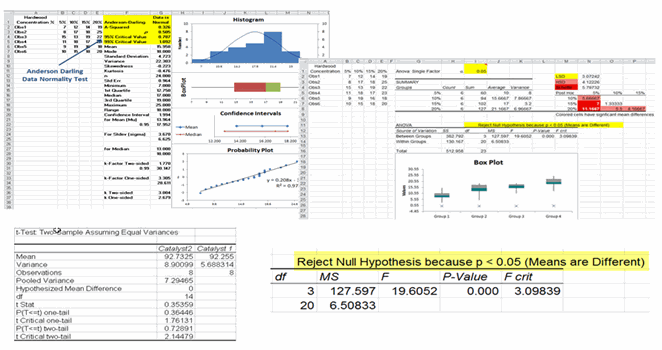
30 statistical tests
- Anova
- t test
- f test
- Data Normality test
- Regression analysis
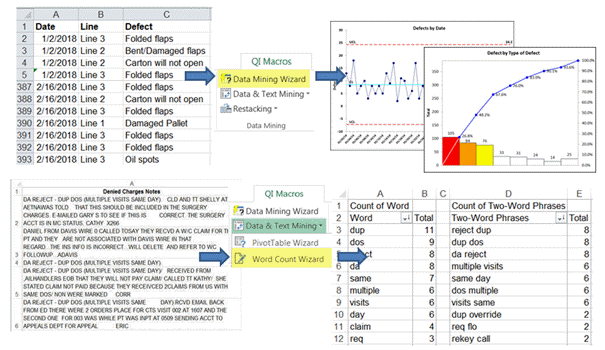
Data Analysis Tools like:
- Improvement Project Wizard
- PivotTable Wizard
- Word Count Wizard
- Data stacking and unstacking tools
We've Thought of Everything
- Wizards (not just decision trees) that analyze your data and select the right chart, control chart or statistical test for you.
- Charts menu that automates common tasks like adding data, recalculating control limits, remembering and applying custom formats.
- Built in rules that can interpret the results for you.
What your organization has done with the excel macros is great. It saves me a lot of time by not having to create the formulas and links. Your QI Macro's are better than most SPC specific software on the market. I have been using your macros since 1997.
- Chuck Whitaker
Nishikawa Standard Co.
I’ve been using your QI Macros for the last ten years and have always found them the best and lowest cost tool available. The other “stat” and charting programs are way too expensive and complex for most of the QA people that I’ve trained.
- Steve Hoyt
ASQ Program Chair
I had no idea how very much could be done on QI Macros. I am particularly excited to try a Fishbone diagram and to see how some of the other quality tools work. I was expecting the charting, but these other tools are the icing on the cake!- Barbara
Join 100,000+ Users
in 80 Countries


KnowWare International, Inc.
2696 S. Colorado Blvd., Ste. 555
Denver, CO 80222 USA
Toll-Free: 1-888-468-1537
Local: (303) 756-9144