Struggling to Create Fishbone Diagrams in Visio or Excel?
QI Macros Automates Ishikawa "Fishbone" Diagrams. Draw them in seconds
QI Macros installs on Excel's menu
To create a fishbone diagram:
1. Select fishbone on QI Macros menu
2. Enter your text into the template
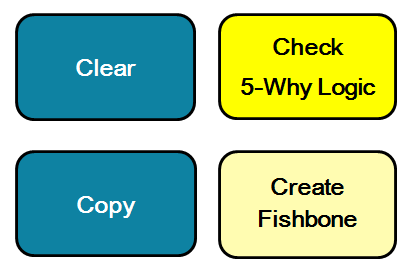
3. Click "Create Fishbone"
QI Macros does the rest!
Why Does It Matter?
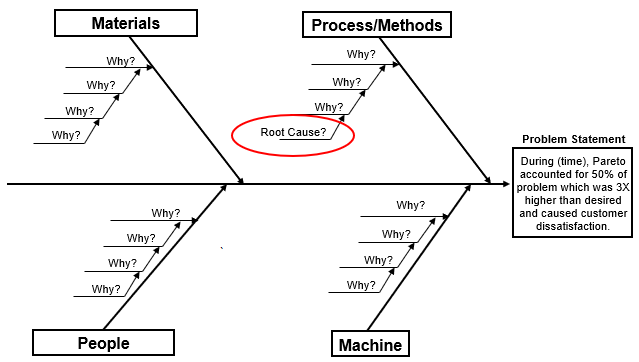
Getting to the right root cause can be a challenge. The wrong root cause results in an incorrect diagnosis leading to incorrect treatment, waste and rework.
Go Deeper: Steps to draw a fishbone diagram in seconds using QI Macros
Input your text into the template
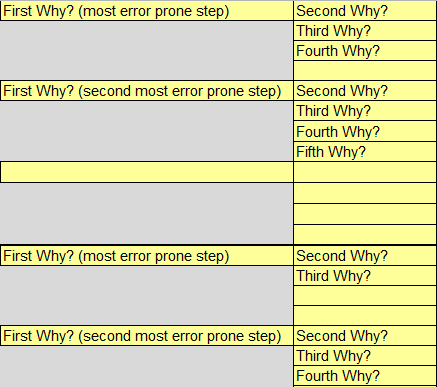
Your fishbone will appear in seconds
QI Macros is a fantastic tool. It allows me to do things that once took 30-60 minutes down to 2-3 minutes. It's also very user-friendly and easy to operate.
- Wade Johnson, Carlson Craft Business Solutions
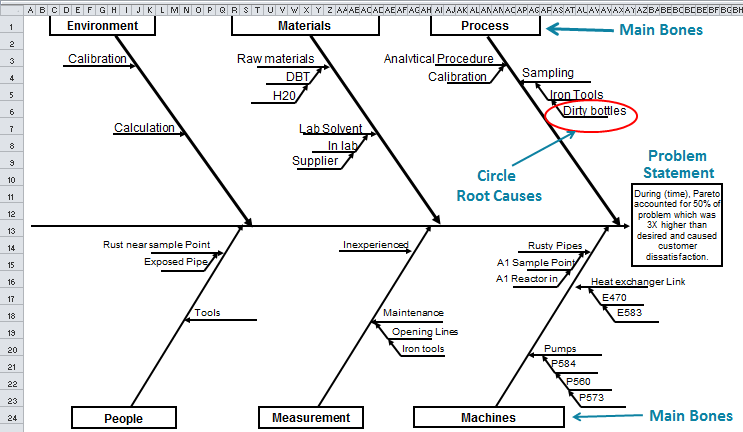
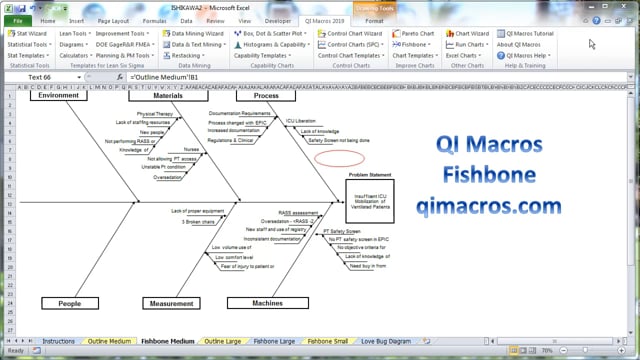
Larger View of the Fishbone Diagram that QI Macros Creates
NOTE: If you end up with too many bones, you may be doing a "Whalebone" diagram.
This means that the problem wasn't divided enough using Pareto charts, and it is recommended to re-evaluate and narrow your focus. Once you have done so, use the Outline Medium/Fishbone Medium to perform your Root Cause Analysis.
Updating and Sharing Your Fishbone is Just as Easy!
To revise the Fishbone: go back to the input tab and update your text, then click "Create Fishbone" again.
To copy and share your fishbone to PowerPoint or Word: Click on the "Copy" button, then paste the fishbone diagram as either a picture or drawing object. Pictures are static. Drawing objects can be revised.
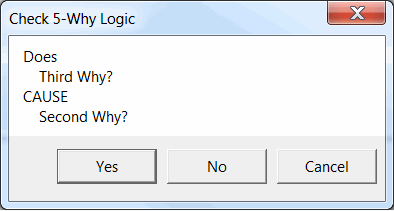
To check the logic in your fishbone, click on the Check 5 Whys Logic button.
Watch this video for a more detailed demo of the automated fishbone diagram
Beautiful, we love the program. It's exactly what we were looking for. Thank you.
- Debra Shank, Georgetown Memorial Hospital
Small Fishbone Diagram
If you open the Fishbone Diagram template and select the "Fishbone Small" tab:

You will need to update the diagram manually, as this Fishbone Diagram is NOT automated - only the "Outline Medium" and "Outline Large" Fishbone Diagrams are automated:
Stop Struggling with Fishbone Diagrams!
Start creating your Fishbone Diagrams in just minutes.
Download a free 30-day trial. Get Fishbone Diagrams now!
Learn More...
- Fishbone Analysis - 5 Whys to Get to the Root Cause
- Customizing QI Macros Fishbone Template
- Love Bug Diagram for Root Cause Analysis
Other Charts Included in QI Macros Add-in for Excel

KnowWare International, Inc.
2696 S. Colorado Blvd., Ste. 555
Denver, CO 80222 USA
Toll-Free: 1-888-468-1537
Local: (303) 756-9144