Home » Free Training » Yellow Belt Videos » SPC Case Study - Wafer Strength
SPC Case Study - Wafer Strength
Use Control Charts and Histograms to Analyze a Process Video
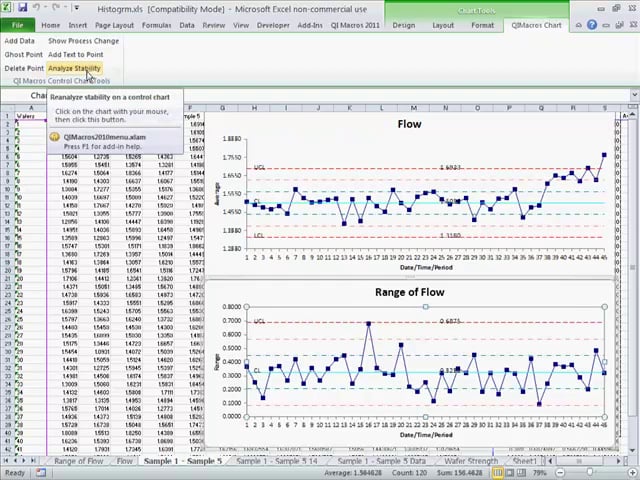
How to evaluate process stability and capability using control charts and histograms using wafer strength data.
QI Macros & Excel Practice
Open QI Macros Test Data/XbarR.xlsx/Wafer Strength, then run XbarR chart and Histogram.