Home » Free Training » Yellow Belt Videos » SPC Case Study - Staff Levels
Healthcare SPC Video - Staffing Levels
XbarR Charts & Histograms to Evaluate Process Stability & Capability
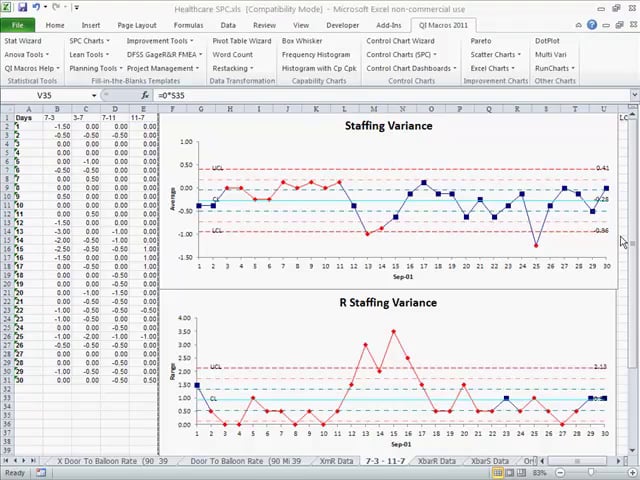
How to evaluate process stability and capability using XbarR control charts and histograms using healthcare data.
QI Macros & Excel Practice
Open QI Macros Test Data/Healthcare SPC.xlsx/XbarR Data and run XbarR & Histogram.