Home » Free Training » Yellow Belt Videos » Ishikawa Fishbone Diagram
Six Sigma - Ishikawa Fishbone Diagram
Ask the Five Whys's
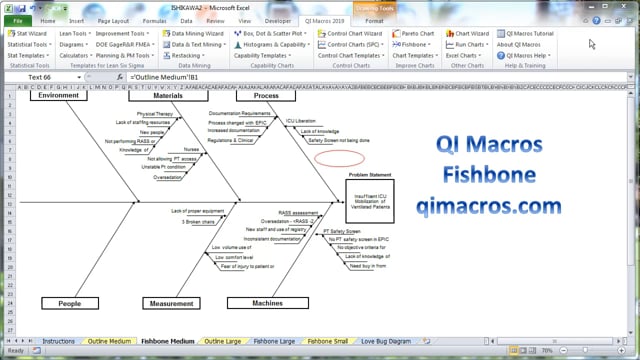
This video shows how to perform root cause analysis using the QI Macros Ishikawa-Fishbone Diagram in Excel.
QI Macros & Excel Practice
Click on Improvement Tools - Ishikawa Fishbone Diagram and fill out the template. Then hit the Create Fishbone Button.