Home » Free Training » Yellow Belt Videos » Control Charts
Six Sigma - Control Charts
Drawing Control Charts in Excel using QI Macros
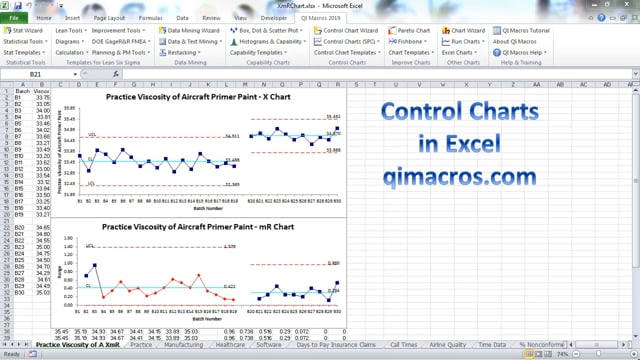
This video shows how to draw control charts in Excel using the QI Macros SPC Software.
QI Macros & Excel Practice
Load QI Macros 30-day trial. Next click on QI Macros Help on the far right side of the menu to open the test data folder.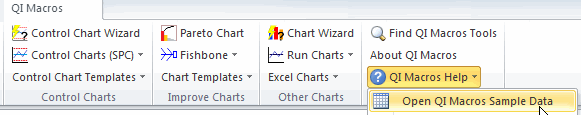
Open the XmR Chart.xlsx file and follow the Practice application to run a chart.