Home » Free Training » Yellow Belt Videos » SPC Case Study - p chart
SPC Case Study - Automotive Test Discrepancies
Use p Charts to Analyze Process Stability Video
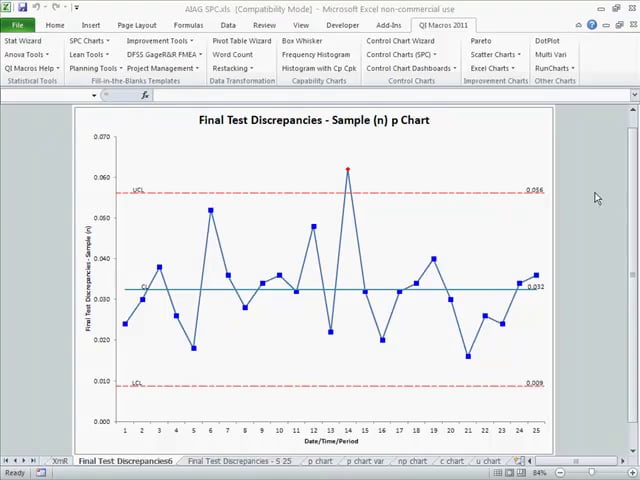
This video shows how to evaluate process stability using p control charts and focus improvement using pareto charts.
QI Macros & Excel Practice
Open QI Macros Test Data/AIAG SPC.xlsx/p Chart and run p Chart & Pareto.