Home » Free Training » Yellow Belt Videos » SPC Example - C Sections
SPC Case Study Video - C Sections
Use p Charts to Track Fraction Defective
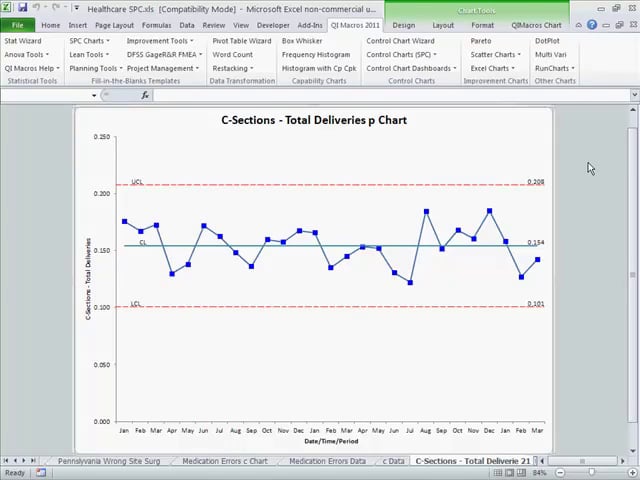
This video shows how to evaluate process stability using p control charts and healthcare data.
QI Macros & Excel Practice
Open QI Macros Test Data/Healthcare SPC.xlsx/p Data and run p Chart.