Home » Free Training » Yellow Belt Videos » SPC Case Study - XbarR chart
SPC Case Study - Automotive DIOUEW Length
Use XbarR Charts and Histograms to Evaluate a Process Video
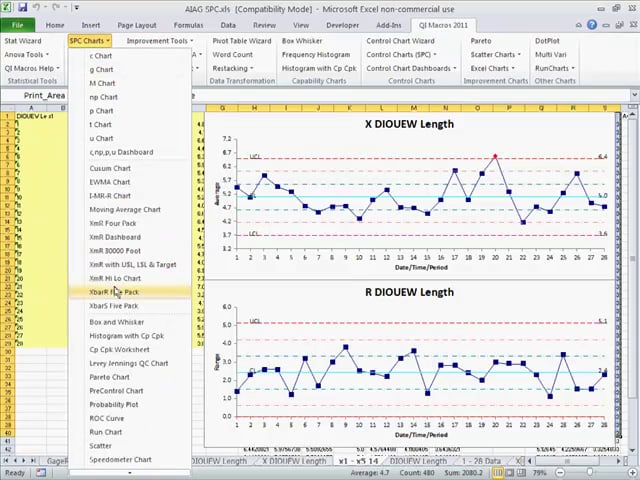
This video shows how to evaluate process stability and capability using control charts and histograms with Cp and Cpk on automotive data.
QI Macros & Excel Practice
Open QI Macros Test Data/AIAG SPC.xlsx/XbarR 2nd Run XbarR & histogram.