Need to Create Control Charts on Healthcare Data?
QI Macros Add-in Draws Control Charts Right in Excel!
See these examples using data from the Health Care Data Guide, by Provost and Murray
A popular Healthcare book on performance measurement is the Health Care Data Guide, ©2011 John Wiley & Sons. The book covers how to use control charts to analyze and maintain patient safety and quality.
Control charts are a valuable tool, but they can be hard to draw without software like QI Macros add-in for Excel. QI Macros is super easy to use and can create all of the run charts, p/u charts and XmR charts that feature prominently in the book.
QI Macros meets IHI Improvement Advisor SPC Software Requirements too!
Draw control charts in seconds using QI Macros Add-in for Excel
QI Macros installs on Excel's menu. To create a chart you simply select your data and then select the chart you want from QI Macros menu. QI Macros does the rest! If you don't know which chart to choose, QI Macros control chart wizard can select the right chart for you.
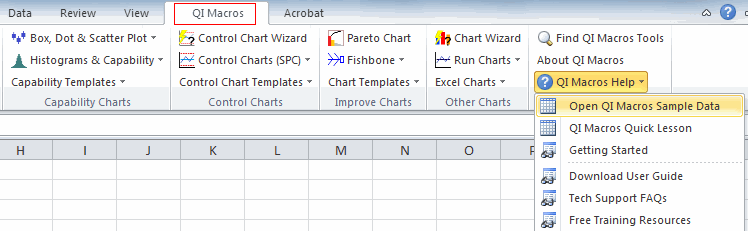
To help you practice, QI Macros loads data examples, including some from the Health Care Data Guide. Select QI Macros Help >> Open QI Macros Sample Data to access the data sample spreadsheets.
How to Videos
Watch the videos below to learn how to use QI Macros to create each chart. The page reference for the data used in each video is listed to the right. The book doesn't contain the data for all of the charts, but these should get you started.
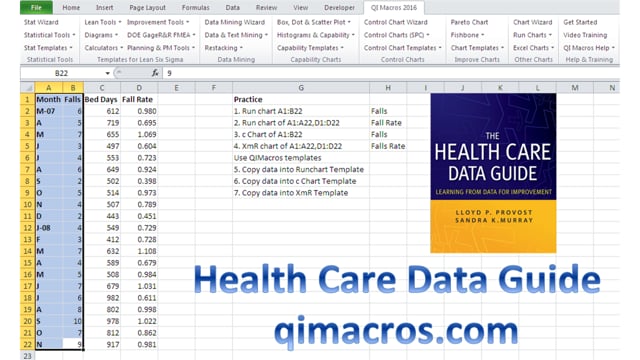
How to create run chart, p charts and XmR Charts of Patient Falls
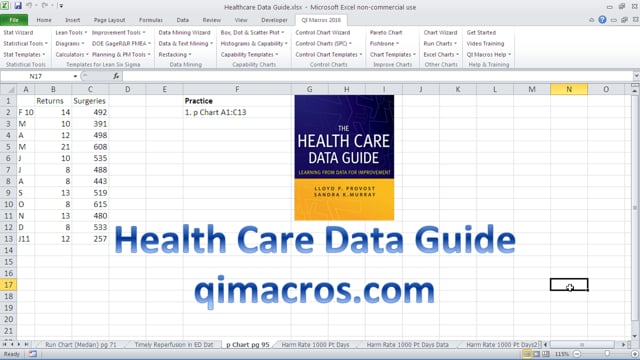
How to create p chart of Unplanned Returns to the OR
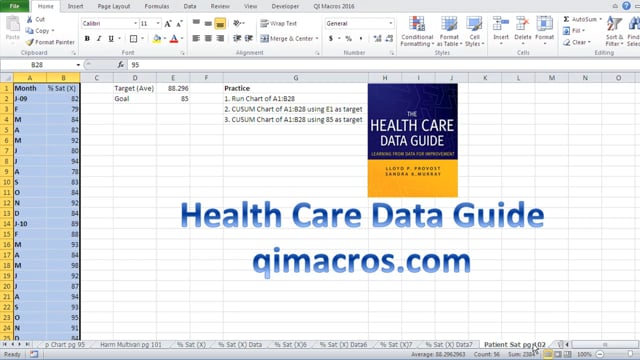
How to create CUSUM chart of Patient Satisfaction
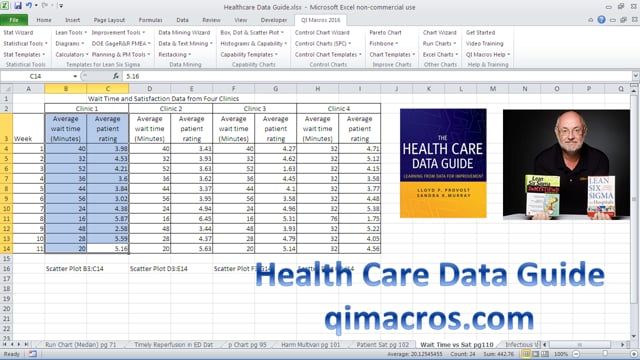
How to create scatter chart of Wait Time vs Patient Satisfaction
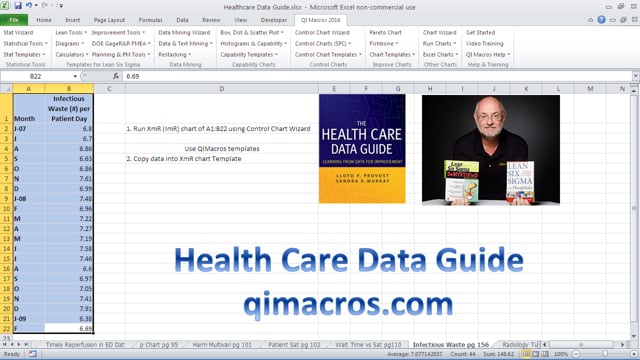
How to create a XmR chart of Infectious Waste
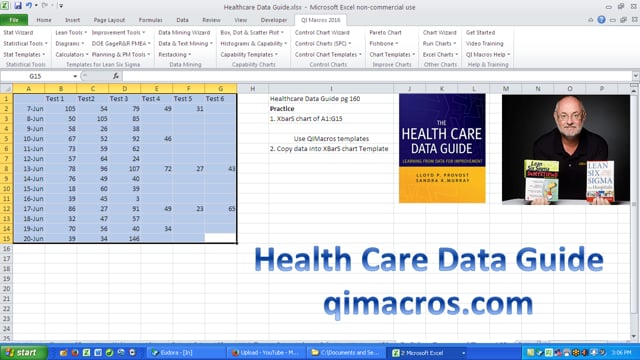
How to create an XbarS chart of Radiology Turnaround Times
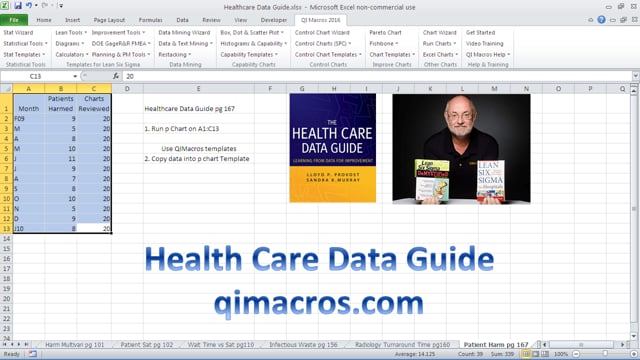
How to create p chart of Patient Harm
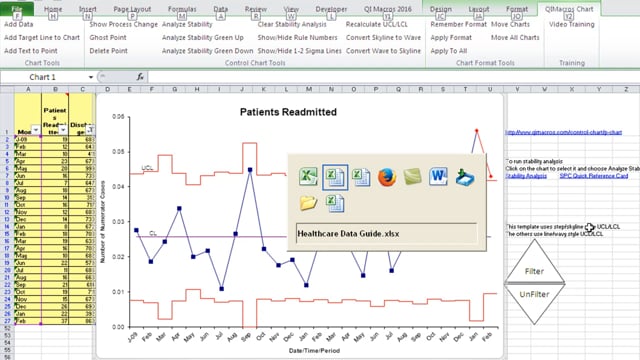
How to create p chart of Hospital Readmissions
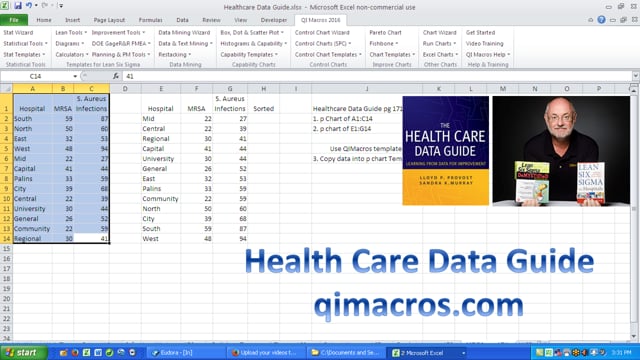
How to create p chart of MRSA
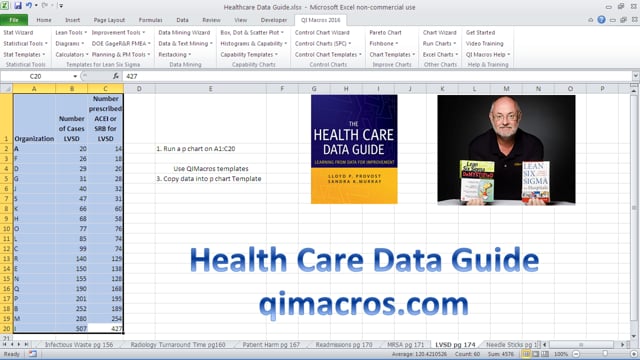
How to create p chart of LVSD
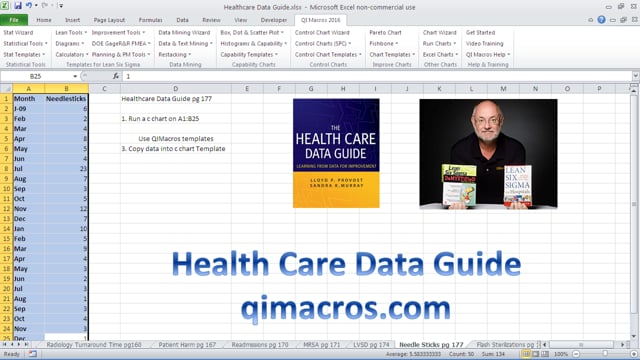
How to create c chart of Needle Sticks
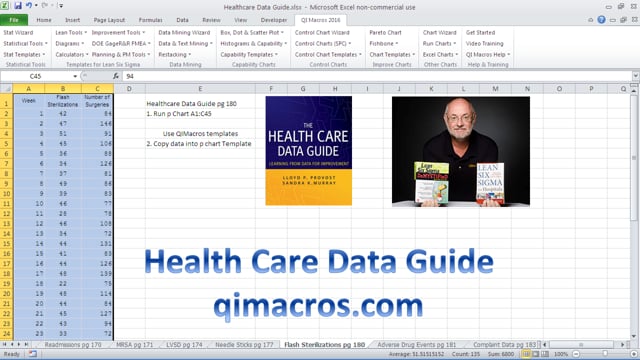
How to create p chart of Flash Sterilizations
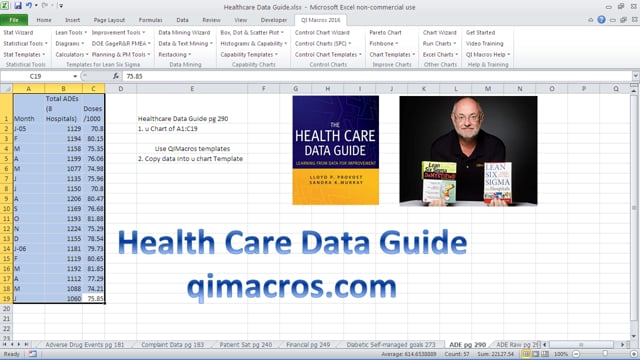
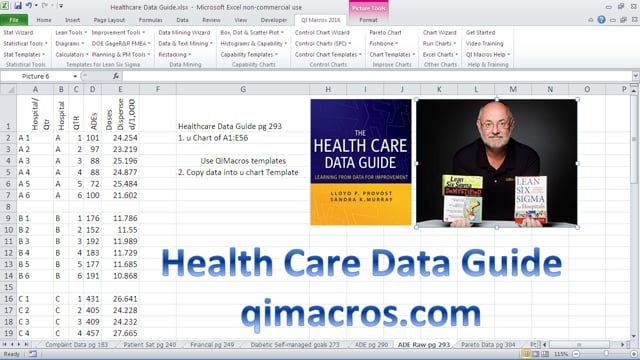
How to create u chart of Adverse Drug Events (ADE)
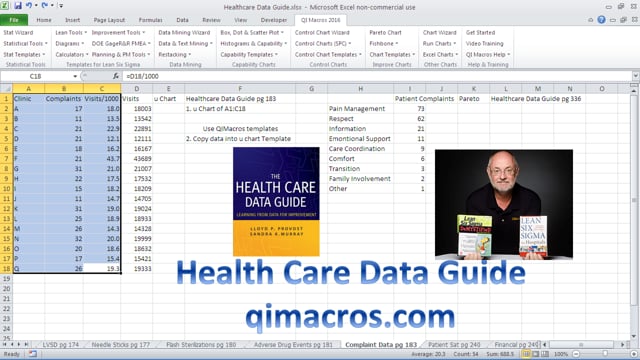
How to create u chart of Complaints
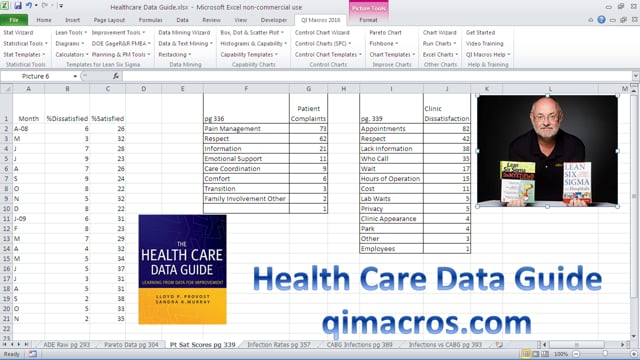
How to create Pareto chart of Patient Satisfaction
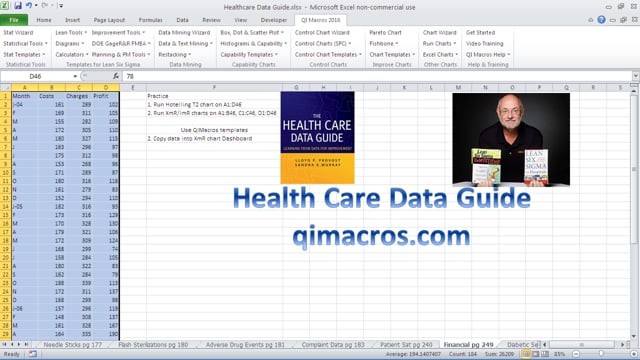
How to create Hotelling T2 chart of Financials
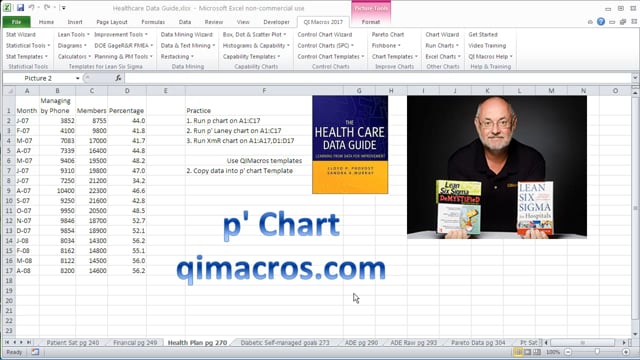
How to create p' chart of Patient Management by Phone
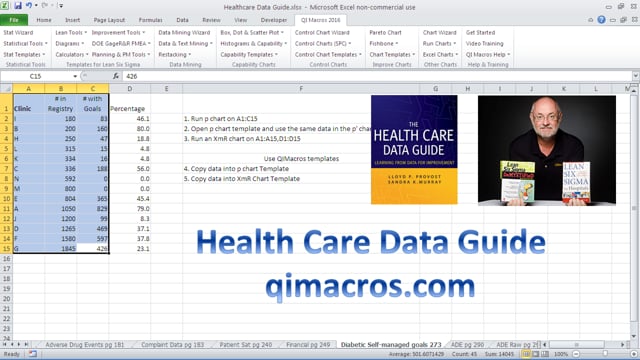
How to create p chart of Diabetic Self-Managed Goals
How to create u chart of ADEs
How to create u chart of ADEs By Hospital
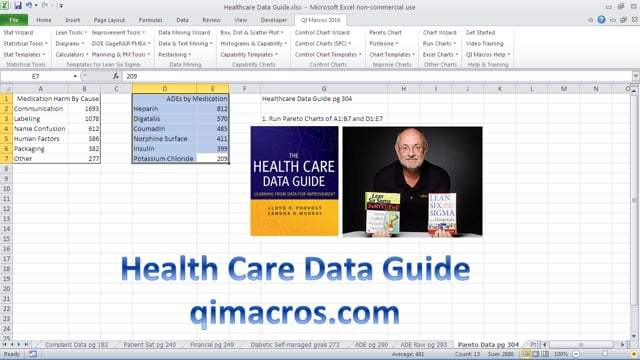
How to create Pareto Chart of Medication Harm
How to create p chart and Pareto Charts of Patient Satisfaction Scores
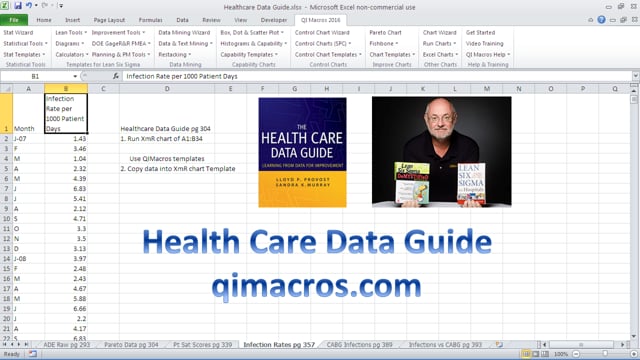
How to create XmR chart of Infection Rates
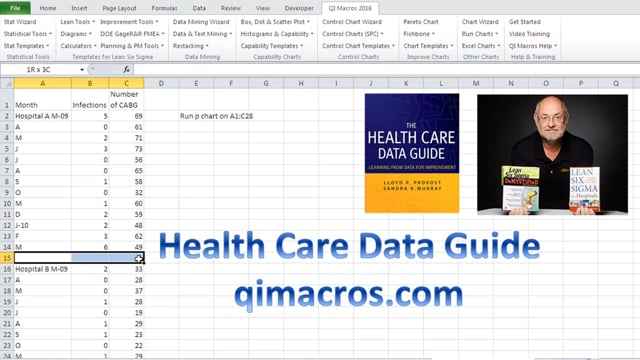
How to create u chart of CABG Infections
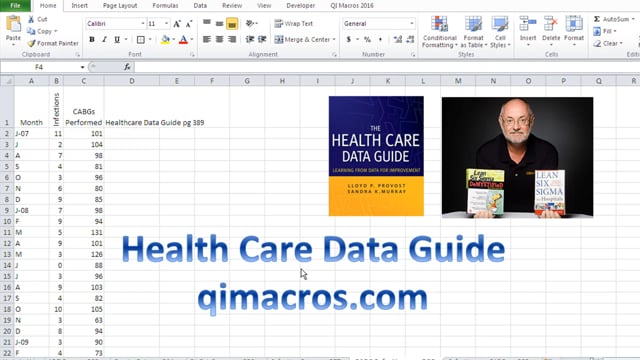
How to create p chart of CABG Infections
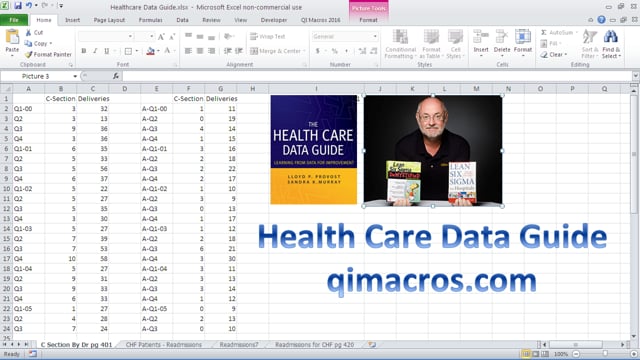
How to create p chart of C Sections by Hospital and physician
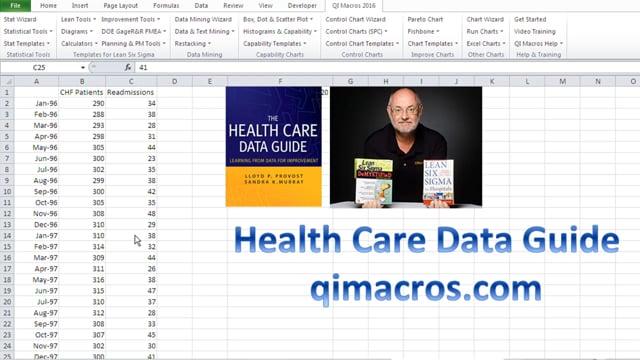
How to create p chart of CHF Readmissions
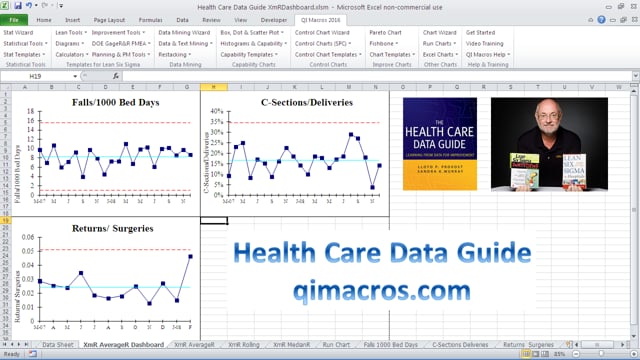
How to create p and XmR dashboards of health care data
To Learn How QI Macros Meets or Exceeds IHI Improvement Advisor Requirements (Click Here)
Other Charts Included in QI Macros Add-in for Excel
Join 100,000+ Users
in 80 Countries

Why Choose QI Macros ?
Affordable - Just $
379 USD per license
- Less with Quantity Discounts
- No Recurring Annual Fees
- No Charge for Technical Support
Easy to Use
- Adds New Tab to Excel's Menu
- Creates a Chart in Seconds
- PC / Mac: Excel Excel 2021-2024, Office 365
Trusted /
Accurate
- 100,000 Users in 80 Countries
- Save Time vs Writing Formulas
- Our Formulas Are Tested

KnowWare International, Inc.
2696 S. Colorado Blvd., Ste. 555
Denver, CO 80222 USA
Toll-Free: 1-888-468-1537
Local: (303) 756-9144