Use QI Macros to Draw Control Charts Described in
Statistical Process Control - Second Edition, published by AIAG
 A popular automotive book on performance measurement is the Statistical Process Control - Second Edition, © 2005 by AIAG (Automotive Industry Action Group). The book covers how to use control charts to analyze and maintain product safety and quality.
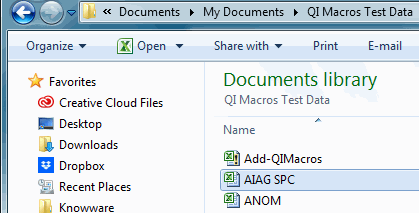
It's easy to use QI Macros to create the control charts that feature prominently in the book. If you have installed QI Macros (purchased or trial) you already have an Excel spreadsheet containing many of the data sets described in this book. Look in: My Documents > QI Macros Test Data > AIAG SPC.xlsx.
Watch the videos below to learn how to use QI Macros to create each chart. The page reference for the data used in each video is listed to the right. The book doesn't contain the data for all of the charts, but these should get you started:
| Statistical Process Control - Second Edition Chart | Page |
|---|---|
| XbarR chart - AIAG DIOUEW Length | 78 |
| Median and Range Chart | 84 |
| XmR ImR chart - AIAG Acid Concentration | 86 |
| p chart - AIAG Test Discrepancies | 88 |
| np chart - AIAG Spot Weld Flaws | 92 |
| u chart - AIAG Dock Audit | 94 |
| c chart - AIAG Bolt Defects | 96 |
| XbarR & Histogram of Diameters | 186 |
XbarR chart - AIAG DIOUEW Length
Median and Range Chart
XmR ImR Chart of Acid Concentration
c chart - AIAG Bolt Defects
np chart - AIAG Spot Weld Flaws
p chart - AIAG Test Discrepancies
u chart - AIAG Dock Audit
XbarR & Histogram of Diameters
To find these data sets from the AIAG Statistical Process Control - 2nd Ed., go to QI Macros Help menu and select Open QI Macros Sample Data.
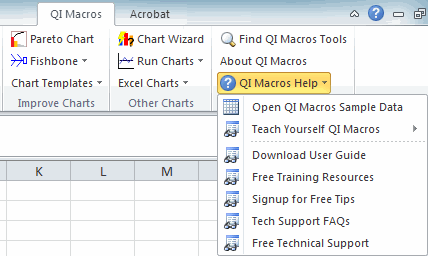
The file with the data from AIAG can be found near the top.
Why wait? Start creating these charts and diagrams in seconds using
QI Macros add-in for Excel.
Join 100,000+ Users
in 80 Countries

Why Choose QI Macros ?
Affordable - Just $
379 USD per license
- Less with Quantity Discounts
- No Recurring Annual Fees
- No Charge for Technical Support
Easy to Use
- Adds New Tab to Excel's Menu
- Creates a Chart in Seconds
- PC / Mac: Excel Excel 2021-2024, Office 365
Trusted /
Accurate
- 100,000 Users in 80 Countries
- Save Time vs Writing Formulas
- Our Formulas Are Tested

KnowWare International, Inc.
2696 S. Colorado Blvd., Ste. 555
Denver, CO 80222 USA
Toll-Free: 1-888-468-1537
Local: (303) 756-9144