SPC Software Chart Comparison
QI Macros Charts Make You Look Like an Expert
Create Charts in Minutes that Look Like They Took Hours
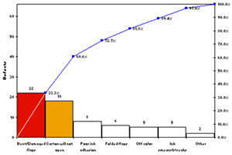
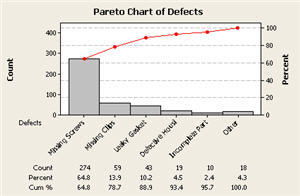
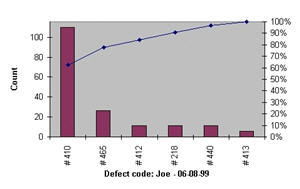
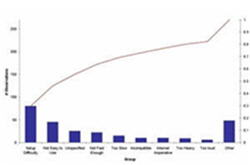
Pareto Charts: A key element of a pareto chart is the cumulative line graph which shows the percent contribution of all preceding bars. This helps determine how much each bar or combination of bars represents of the problem. Unfortunately, most SPC software packages miss the point. The pareto charts created by these applications don't display the cumulative percentages at all or display them in a manner that is hard to correspond to the graph.
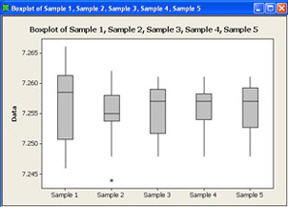
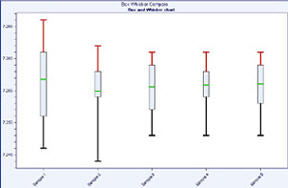
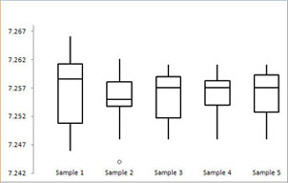
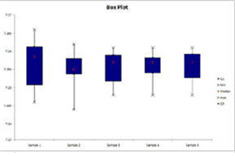
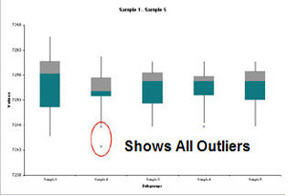
Box and Whisker Plots: A key element of a Box and Whisker Plot is the outliers. Outlier points are those that are greater than 1.5 times (Q3-Q1). Again, most SPC Sofware packages omit these from their Box and Whisker Plots.
Pareto Chart
|
QI Macros® $369 USD
Bars over 20% of the total are shaded. |
Minitab® Annual License: $1,851
Left axis isn't scaled properly and cumulative line graph doesn't extend through the chart as it should. |
CHARTrunner Lean / SQC Pack® $1,290
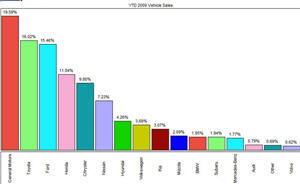
There is no cumulative line graph so this isn't really a pareto, just a sorted bar chart. |
SigmaXL® $299
Pareto background is gray; bars don't touch; left axis isn't scaled properly; and cumulative line graph doesn't extend through the chart as it should. And you can't read the cumulative percentages off of the line. |
SPC XL $299
The bars don't touch; and cumulative line graph doesn't extend through the chart as it should. The cumulative percentages are not shown on the line. |
Box and Whisker Plot
|
 |
Minitab® Annual License: $1,851 |
CHARTrunner Lean / SQC Pack® $1,290 |
SigmaXL® $299
Second and Third Quartiles within the box are the same color. |
SPC XL $299 |
What People are Saying...
I have been a fan and advocate for QI Macros for about as long as you have been in business. For the past 10 years I have been an ISO 9000 Consultant and use QI Macros for my data analysis and have had most of my customers buy QI Macros. All of my customers are small companies, QI Macros meets and exceeds their needs at a fraction of the costs of a Mintab or other similar products.
Tom Arneson, Focus Consulting LLC

